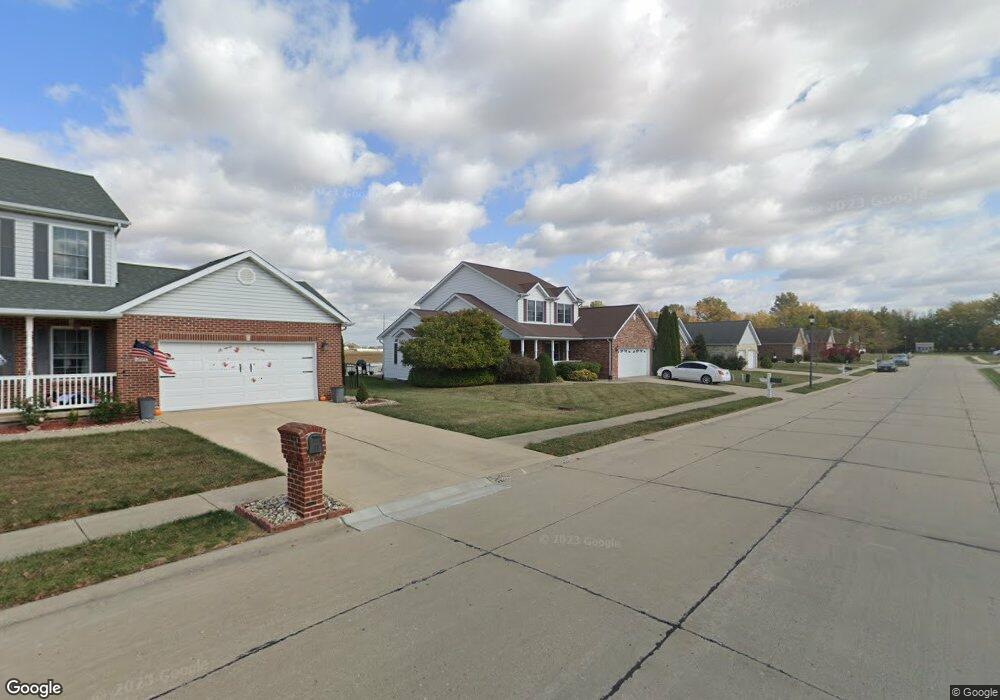
505 Whetstone Ln Mascoutah, IL 62258
Estimated Value: $281,000 - $385,000
--
Bed
--
Bath
822
Sq Ft
$388/Sq Ft
Est. Value
About This Home
This home is located at 505 Whetstone Ln, Mascoutah, IL 62258 and is currently estimated at $318,661, approximately $387 per square foot. 505 Whetstone Ln is a home located in St. Clair County with nearby schools including Mascoutah High School and Holy Childhood of Jesus School.
Ownership History
Date
Name
Owned For
Owner Type
Purchase Details
Closed on
Oct 25, 2017
Sold by
Roper Sasia L and Roper Duncan E
Bought by
Roper Duncan E
Current Estimated Value
Home Financials for this Owner
Home Financials are based on the most recent Mortgage that was taken out on this home.
Original Mortgage
$203,278
Outstanding Balance
$171,008
Interest Rate
4%
Mortgage Type
VA
Estimated Equity
$147,653
Purchase Details
Closed on
May 10, 2004
Sold by
Kappert Construction Inc
Bought by
Roper Sasia L and Roper Duncan E
Home Financials for this Owner
Home Financials are based on the most recent Mortgage that was taken out on this home.
Original Mortgage
$237,100
Interest Rate
5.62%
Mortgage Type
Purchase Money Mortgage
Purchase Details
Closed on
Dec 1, 2003
Sold by
Stonemark Development Llc
Bought by
Kappert Construction Inc
Home Financials for this Owner
Home Financials are based on the most recent Mortgage that was taken out on this home.
Original Mortgage
$31,900
Interest Rate
6.1%
Mortgage Type
Seller Take Back
Create a Home Valuation Report for This Property
The Home Valuation Report is an in-depth analysis detailing your home's value as well as a comparison with similar homes in the area
Home Values in the Area
Average Home Value in this Area
Purchase History
| Date | Buyer | Sale Price | Title Company |
|---|---|---|---|
| Roper Duncan E | -- | Closing Usa Llc | |
| Roper Sasia L | $238,000 | Town & Country Title Co | |
| Kappert Construction Inc | -- | -- |
Source: Public Records
Mortgage History
| Date | Status | Borrower | Loan Amount |
|---|---|---|---|
| Open | Roper Duncan E | $203,278 | |
| Closed | Roper Sasia L | $237,100 | |
| Previous Owner | Kappert Construction Inc | $31,900 | |
| Closed | Kappert Construction Inc | $130,000 |
Source: Public Records
Tax History Compared to Growth
Tax History
| Year | Tax Paid | Tax Assessment Tax Assessment Total Assessment is a certain percentage of the fair market value that is determined by local assessors to be the total taxable value of land and additions on the property. | Land | Improvement |
|---|---|---|---|---|
| 2024 | $7,930 | $112,726 | $16,242 | $96,484 |
| 2023 | $7,533 | $103,022 | $14,844 | $88,178 |
| 2022 | $7,428 | $93,758 | $13,509 | $80,249 |
| 2021 | $7,252 | $90,242 | $13,085 | $77,157 |
| 2020 | $6,933 | $84,648 | $12,274 | $72,374 |
| 2019 | $6,764 | $84,648 | $12,274 | $72,374 |
| 2018 | $6,614 | $82,374 | $11,944 | $70,430 |
| 2017 | $6,705 | $79,875 | $12,811 | $67,064 |
| 2016 | $6,630 | $78,726 | $12,627 | $66,099 |
| 2014 | $5,860 | $76,926 | $12,338 | $64,588 |
| 2013 | $5,741 | $75,834 | $12,163 | $63,671 |
Source: Public Records
Map
Nearby Homes
- 414 Turquoise Ct
- 633 Moorland Cir
- 841 Topaz Ct
- 847 Topaz Ct
- 3 W Patterson St
- 25 W Oak St
- 612 N 1st St
- 108 E Main St
- 57 W Patterson St
- 118 W Green St
- 124 W State St
- 1117 Gulfstream Way
- 1125 Gulfstream Way
- 1135 Lear Ln
- 344 Douglas Ave Unit B
- 1153 Gulfstream Way
- 1204 Lear Ln
- 9715 Winchester St
- 326 S 5th St
- 500 N 9th St
- 509 Whetstone Ln
- 501 Whetstone Ln
- 558 Redstone Ct
- 513 Whetstone Ln
- 409 Whetstone Ln
- 557 Streamstone Ln
- 561 Redstone Ct
- 601 Whetstone Ln
- 405 Whetstone Ln
- 554 Redstone Ct
- 553 Streamstone Ln
- 555 Redstone Ct
- 401 Whetstone Ln
- 605 Whetstone Ln
- 549 Streamstone Ln
- 556 Bluestone Ct
- 550 Redstone Ct
- 556 Streamstone Ln
- 551 Redstone Ct
- 552 Bluestone Ct