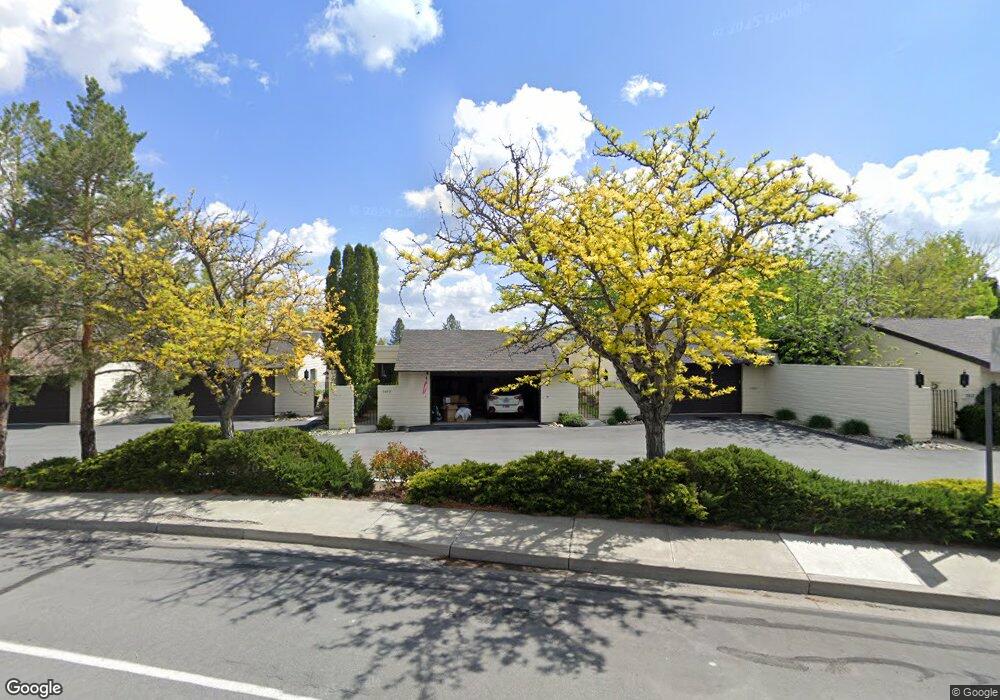
5050 Lakeridge Terrace E Unit 314 Reno, NV 89509
Skyline Boulevard NeighborhoodEstimated Value: $513,512 - $560,000
2
Beds
2
Baths
1,680
Sq Ft
$321/Sq Ft
Est. Value
About This Home
This home is located at 5050 Lakeridge Terrace E Unit 314, Reno, NV 89509 and is currently estimated at $539,378, approximately $321 per square foot. 5050 Lakeridge Terrace E Unit 314 is a home located in Washoe County with nearby schools including Huffaker Elementary School, Edward L Pine Middle School, and Reno High School.
Ownership History
Date
Name
Owned For
Owner Type
Purchase Details
Closed on
Oct 13, 2010
Sold by
Peterson Mark and Lor Hang
Bought by
David W Wolgast Family Trust
Current Estimated Value
Purchase Details
Closed on
Nov 11, 2009
Sold by
Rhoads John Pierce and Bush Rhoads Starry Lane
Bought by
Peterson Mark and Lor Hang
Purchase Details
Closed on
Jul 11, 2005
Sold by
Boettcher William E and Boettcher Mary M
Bought by
Rhoads John P and Bush Rhoads Starry
Home Financials for this Owner
Home Financials are based on the most recent Mortgage that was taken out on this home.
Original Mortgage
$287,000
Interest Rate
5.55%
Mortgage Type
Stand Alone First
Purchase Details
Closed on
May 26, 1999
Sold by
Boettcher William E and Boettcher Mary M
Bought by
Boettcher William E and Boettcher Mary M
Create a Home Valuation Report for This Property
The Home Valuation Report is an in-depth analysis detailing your home's value as well as a comparison with similar homes in the area
Home Values in the Area
Average Home Value in this Area
Purchase History
| Date | Buyer | Sale Price | Title Company |
|---|---|---|---|
| David W Wolgast Family Trust | $175,000 | Western Title Company | |
| Peterson Mark | $175,000 | Western Title Inc Ridge | |
| Rhoads John P | $387,000 | First Centennial Title Co | |
| Boettcher William E | -- | -- |
Source: Public Records
Mortgage History
| Date | Status | Borrower | Loan Amount |
|---|---|---|---|
| Previous Owner | Rhoads John P | $287,000 |
Source: Public Records
Tax History Compared to Growth
Tax History
| Year | Tax Paid | Tax Assessment Tax Assessment Total Assessment is a certain percentage of the fair market value that is determined by local assessors to be the total taxable value of land and additions on the property. | Land | Improvement |
|---|---|---|---|---|
| 2025 | $2,034 | $83,123 | $46,620 | $36,503 |
| 2024 | $2,034 | $76,952 | $40,075 | $36,877 |
| 2023 | $1,853 | $76,755 | $44,870 | $31,885 |
| 2022 | $1,805 | $59,562 | $32,620 | $26,942 |
| 2021 | $1,756 | $55,046 | $27,020 | $28,026 |
| 2020 | $1,698 | $56,993 | $27,755 | $29,238 |
| 2019 | $1,753 | $56,299 | $26,005 | $30,294 |
| 2018 | $1,700 | $52,898 | $22,295 | $30,603 |
| 2017 | $1,656 | $53,541 | $22,295 | $31,246 |
| 2016 | $1,613 | $50,991 | $18,585 | $32,406 |
| 2015 | $1,611 | $49,359 | $14,980 | $34,379 |
| 2014 | $1,563 | $46,124 | $12,495 | $33,629 |
| 2013 | -- | $43,313 | $10,850 | $32,463 |
Source: Public Records
Map
Nearby Homes
- 2037 Sunburst Way
- 4970 Plumas St
- 1545 Golf Club Dr Unit 4
- 1541 Golf Club Dr Unit Hilltop 5
- 2108 Chicory Way Unit 2108A
- 4900 Plumas St Unit A113
- 4947 Lakeridge Terrace W
- 1533 Golf Club Dr Unit Hilltop 7
- 1521 Golf Club Dr Unit Hilltop 10
- 1517 Golf Club Dr Unit Hilltop 11
- 1513 Golf Club Dr Unit Hilltop 12
- 4811 Lakeridge Terrace W
- 1509 Golf Club Dr
- 1509 Golf Club Dr Unit Hilltop 13
- 6057 Kelly Heights Way Unit 16
- 4740 Plumas St
- 2012 Branch Ln Unit 2012B
- 4833 Lakeridge Terrace W
- 4875 Golden Springs Dr
- 6055 Stonecreek Dr
- 5050 Lakeridge Terrace E Unit 5050
- 5050 Lakeridge Terrace E
- 5056 Lakeridge Terrace E
- 5056 Lakeridge Terrace E Unit 5F
- 5044 Lakeridge Terrace E
- 5062 Lakeridge Terrace E
- 5038 Lakeridge Terrace E
- 5032 Lakeridge Terrace E
- 5068 Lakeridge Terrace E
- 5026 Lakeridge Terrace E
- 5042 Lakeridge Terrace E
- 5072 Lakeridge Terrace E
- 5066 Lakeridge Terrace E
- 5054 Lakeridge Terrace E
- 5020 Lakeridge Terrace E
- 5078 Lakeridge Terrace E
- 5048 Lakeridge Terrace E
- 5084 Lakeridge Terrace E Unit 2
- 5014 Lakeridge Terrace E
- 5036 Lakeridge Terrace E