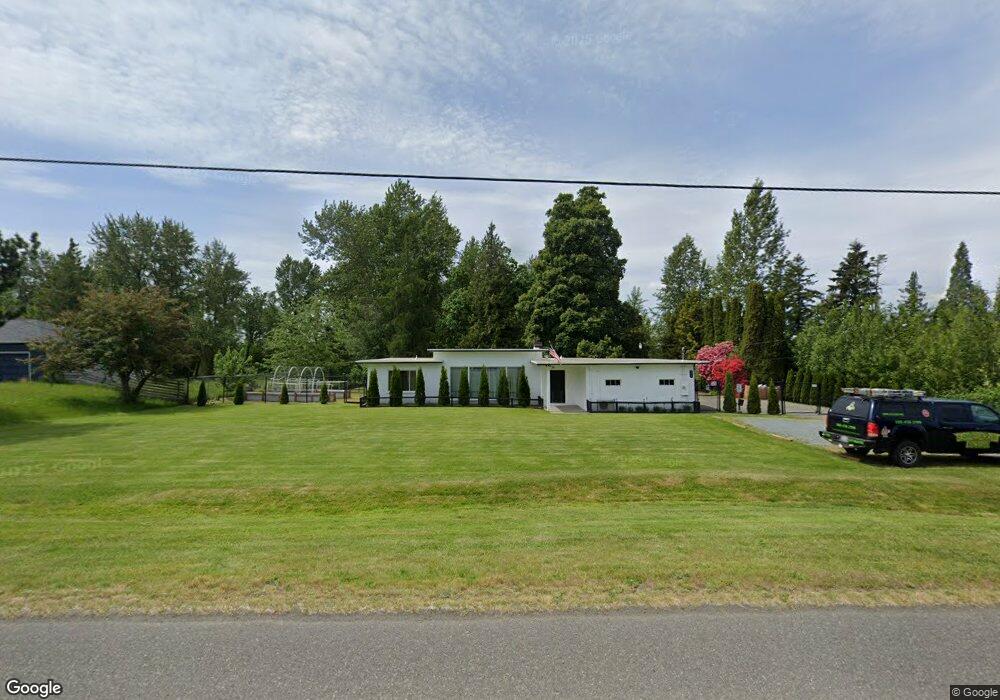
5051 Guide Meridian Bellingham, WA 98226
Estimated Value: $574,000 - $630,000
3
Beds
2
Baths
1,324
Sq Ft
$460/Sq Ft
Est. Value
About This Home
This home is located at 5051 Guide Meridian, Bellingham, WA 98226 and is currently estimated at $609,065, approximately $460 per square foot. 5051 Guide Meridian is a home located in Whatcom County with nearby schools including Irene Reither Elementary School, Meridian Middle School, and Meridian High School.
Ownership History
Date
Name
Owned For
Owner Type
Purchase Details
Closed on
Apr 10, 2025
Sold by
John And Sue Weaver Living Trust and Weaver John Howard
Bought by
Elling Kristofer Ray and Elling Lindsey Ellen
Current Estimated Value
Purchase Details
Closed on
Jan 3, 2024
Sold by
Weaver John H and Weaver Sue Ellen
Bought by
John And Sue Weaver Living Trust and Weaver
Purchase Details
Closed on
Feb 20, 2007
Sold by
Watts Avalea Maye and Sprague Frank Alan
Bought by
Weaver John H and Weaver Sue E
Home Financials for this Owner
Home Financials are based on the most recent Mortgage that was taken out on this home.
Original Mortgage
$248,000
Interest Rate
6.21%
Mortgage Type
Purchase Money Mortgage
Purchase Details
Closed on
Feb 4, 2004
Sold by
Sprague Maye M and Maye Sprague M
Bought by
State Of Washington
Create a Home Valuation Report for This Property
The Home Valuation Report is an in-depth analysis detailing your home's value as well as a comparison with similar homes in the area
Home Values in the Area
Average Home Value in this Area
Purchase History
| Date | Buyer | Sale Price | Title Company |
|---|---|---|---|
| Elling Kristofer Ray | $121,000 | Whatcom Land Title | |
| John And Sue Weaver Living Trust | $313 | None Listed On Document | |
| Weaver John H | $310,280 | First American Title Insuran | |
| State Of Washington | -- | First American Title Ins |
Source: Public Records
Mortgage History
| Date | Status | Borrower | Loan Amount |
|---|---|---|---|
| Previous Owner | Weaver John H | $248,000 |
Source: Public Records
Tax History Compared to Growth
Tax History
| Year | Tax Paid | Tax Assessment Tax Assessment Total Assessment is a certain percentage of the fair market value that is determined by local assessors to be the total taxable value of land and additions on the property. | Land | Improvement |
|---|---|---|---|---|
| 2024 | $4,166 | $535,667 | $250,648 | $285,019 |
| 2023 | $4,166 | $532,457 | $258,400 | $274,057 |
| 2022 | $4,641 | $579,859 | $280,347 | $299,512 |
| 2021 | $4,486 | $460,205 | $222,497 | $237,708 |
| 2020 | $3,943 | $407,257 | $196,898 | $210,359 |
| 2019 | $3,245 | $358,819 | $173,480 | $185,339 |
| 2018 | $3,772 | $322,540 | $155,940 | $166,600 |
| 2017 | $3,359 | $285,434 | $138,000 | $147,434 |
| 2016 | $3,272 | $268,877 | $133,548 | $135,329 |
| 2015 | $3,080 | $260,639 | $129,456 | $131,183 |
| 2014 | -- | $237,896 | $118,160 | $119,736 |
| 2013 | -- | $232,178 | $115,320 | $116,858 |
Source: Public Records
Map
Nearby Homes
- 5140 Guide Meridian
- 4866 Guide Meridian
- 4935 E 3rd Dr
- 186 W Smith Rd
- 4777 Guide Meridian Rd
- 546 (Lot 7) Northview St
- 552 (Lot 5) Northview St
- 553 (Lot 19) Northview St
- 555 (Lot 18) Northview St
- 652 (Lot 30) W Kline Rd
- 662 (Lot 26) W Kline Rd
- 654 (Lot 29) W Kline Rd
- 700 Northview St
- 353 Holland Ave
- 703 Northview St
- 409 Holland Ave
- 304 Tremont Ave
- 115 155 Tremont Ave
- 440 Tremont Ave
- 4682 Guide Meridian
- 5058 Guide Meridian
- 5044 Guide Meridian
- 5029 Guide Meridian
- 5042 Guide Meridian
- 5021 Guide Meridian
- 5038 Guide Meridian
- 5022 Guide Meridian
- 5009 Guide Meridian
- 131 W Larson Rd
- 5094 Guide Meridian
- 4999 Guide Meridian
- 145 W Larson Rd
- 122 W Larson Rd
- 5106 Guide Meridian
- 159 W Larson Rd
- 5119 Guide Meridian
- 4982 Guide Meridian
- 0 Guide Meridian Unit 265161
- 0 Guide Meridian Unit 266499
- 0 Guide Meridian Unit 1180579