M
Seller's Agent in 2017
Mark Bullock
NOT A VALID MEMBER
Estimated Value: $208,280 - $249,000
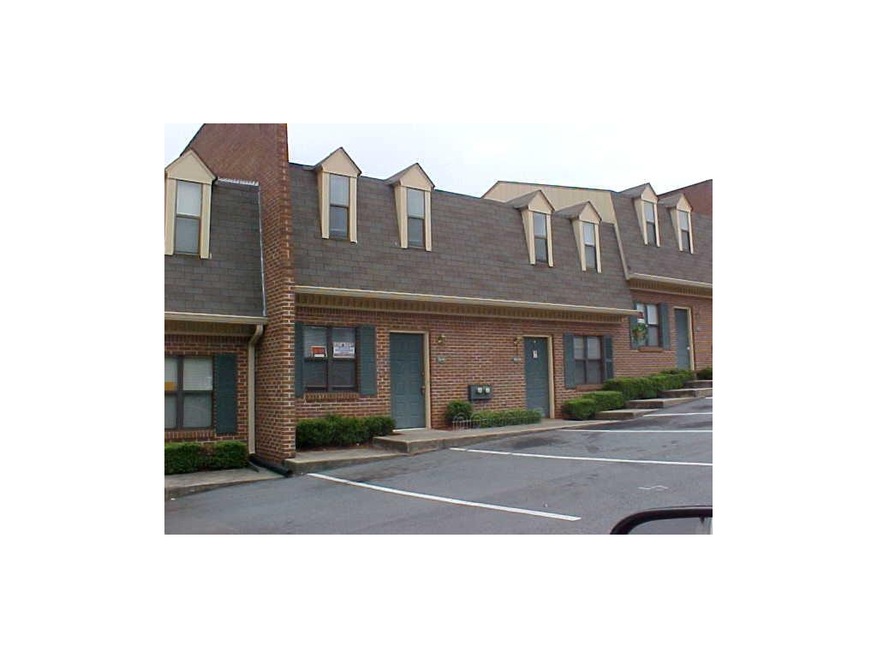
Easily a 7% cap rate for investor with potential for higher market rent. Already leased with solid tenant to July, 2018. Proven track record as a performing asset. Low association dues and separate water meters! Listing Broker also provides full service property management.
Last Agent to Sell the Property
Mark Bullock
NOT A VALID MEMBER Listed on: 11/06/2017
| Date | Buyer | Sale Price | Title Company |
|---|---|---|---|
| Credent Enterprises Llc | $81,000 | -- | |
| Capps Janna R | $89,500 | -- |
| Date | Status | Borrower | Loan Amount |
|---|---|---|---|
| Previous Owner | Capps Janna R | $85,000 |
| Date | Event | Price | List to Sale | Price per Sq Ft |
|---|---|---|---|---|
| 11/30/2017 11/30/17 | Sold | $81,000 | +8.0% | $79 / Sq Ft |
| 11/10/2017 11/10/17 | Pending | -- | -- | -- |
| 11/06/2017 11/06/17 | For Sale | $75,000 | -- | $73 / Sq Ft |
| Year | Tax Paid | Tax Assessment Tax Assessment Total Assessment is a certain percentage of the fair market value that is determined by local assessors to be the total taxable value of land and additions on the property. | Land | Improvement |
|---|---|---|---|---|
| 2025 | $289 | $82,600 | $28,000 | $54,600 |
| 2024 | $2,375 | $68,040 | $8,800 | $59,240 |
| 2023 | $2,375 | $68,040 | $8,800 | $59,240 |
| 2022 | $259 | $68,040 | $8,800 | $59,240 |
| 2021 | $1,378 | $38,600 | $4,800 | $33,800 |
| 2020 | $1,534 | $38,600 | $4,800 | $33,800 |
| 2019 | $1,243 | $32,400 | $4,800 | $27,600 |
| 2018 | $1,248 | $32,400 | $4,800 | $27,600 |
| 2016 | $882 | $22,920 | $4,800 | $18,120 |
| 2015 | $810 | $20,800 | $4,800 | $16,000 |
| 2014 | $814 | $20,800 | $4,800 | $16,000 |
M
Seller's Agent in 2017
Mark Bullock
NOT A VALID MEMBER

Seller Co-Listing Agent in 2017
Lance Carter
Carter Mark Realty Group, LLC
(770) 318-0478
33 Total Sales
Buyer's Agent in 2017
Olubunmi Oshin
Virtual Properties Realty.com
(678) 615-8841
1 in this area
41 Total Sales
Source: First Multiple Listing Service (FMLS)
MLS Number: 5930096
APN: 7-291-296
![]() Listings identified with the FMLS IDX logo come from FMLS and are held by brokerage firms other than the owner of this website. The listing brokerage is identified in any listing details. Information is deemed reliable but is not guaranteed. If you believe any FMLS listing contains material that infringes your copyrighted work please visit www.fmls.com/dmca to review our DMCA policy and learn how to submit a takedown request. © 2025 First Multiple Listing Service, Inc.
Listings identified with the FMLS IDX logo come from FMLS and are held by brokerage firms other than the owner of this website. The listing brokerage is identified in any listing details. Information is deemed reliable but is not guaranteed. If you believe any FMLS listing contains material that infringes your copyrighted work please visit www.fmls.com/dmca to review our DMCA policy and learn how to submit a takedown request. © 2025 First Multiple Listing Service, Inc.
Disclaimer: Certain information contained herein is derived from information provided by parties other than Homes.com. All information provided is deemed reliable, but is not guaranteed to be accurate and should be independently verified.