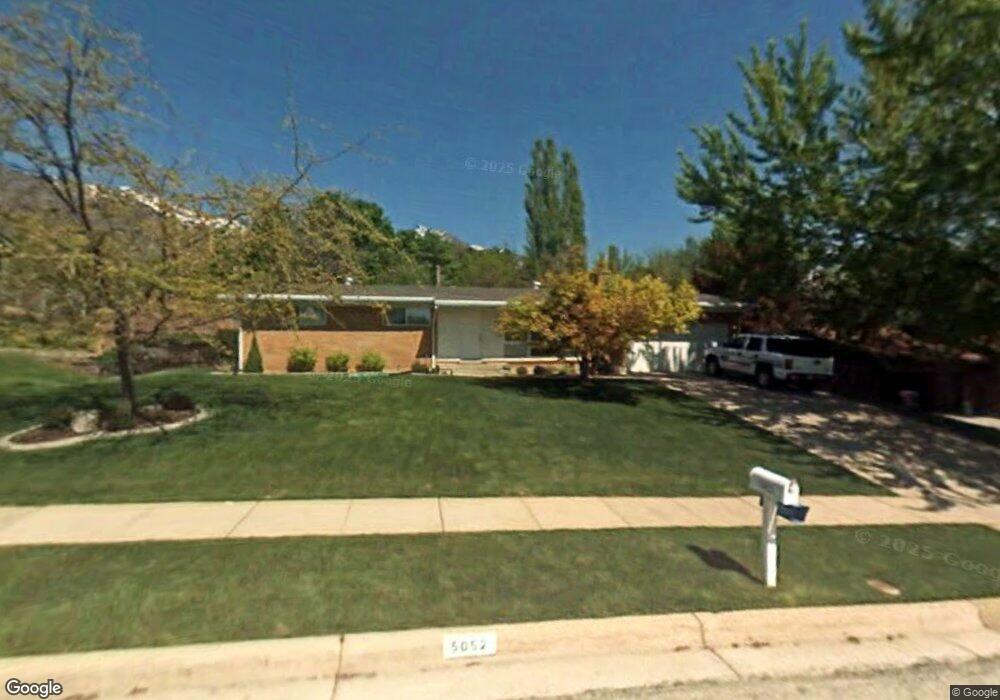
5052 Fillmore Ave Ogden, UT 84403
Southeast Ogden NeighborhoodEstimated Value: $547,000 - $600,000
6
Beds
3
Baths
2,632
Sq Ft
$217/Sq Ft
Est. Value
About This Home
This home is located at 5052 Fillmore Ave, Ogden, UT 84403 and is currently estimated at $571,482, approximately $217 per square foot. 5052 Fillmore Ave is a home located in Weber County with nearby schools including Shadow Valley School, Mount Ogden Junior High School, and Ogden High School.
Ownership History
Date
Name
Owned For
Owner Type
Purchase Details
Closed on
May 4, 2023
Sold by
Blue Scott
Bought by
Blue Scott and Buchanan Mollie
Current Estimated Value
Home Financials for this Owner
Home Financials are based on the most recent Mortgage that was taken out on this home.
Original Mortgage
$570,216
Outstanding Balance
$554,447
Interest Rate
6.42%
Mortgage Type
VA
Estimated Equity
$17,035
Purchase Details
Closed on
Jul 19, 2018
Sold by
Gardiner Paul K and Gardiner Brenda L
Bought by
Gardiner Paul K and Gardiner Brenda L
Purchase Details
Closed on
Mar 6, 2009
Sold by
Gardiner Paul K and Gardiner Brenda L
Bought by
Gardiner Paul K and Gardiner Brenda L
Home Financials for this Owner
Home Financials are based on the most recent Mortgage that was taken out on this home.
Original Mortgage
$30,000
Interest Rate
5.19%
Mortgage Type
Credit Line Revolving
Purchase Details
Closed on
Apr 26, 2005
Sold by
Gardiner Paul K and Gardiner Brenda L
Bought by
Gardiner Paul K and Gardiner Brenda L
Purchase Details
Closed on
Apr 27, 2001
Sold by
Gardiner Paul K and Gardiner Brenda L
Bought by
Gardiner Paul K and Gardiner Brenda L
Create a Home Valuation Report for This Property
The Home Valuation Report is an in-depth analysis detailing your home's value as well as a comparison with similar homes in the area
Home Values in the Area
Average Home Value in this Area
Purchase History
| Date | Buyer | Sale Price | Title Company |
|---|---|---|---|
| Blue Scott | -- | None Listed On Document | |
| Blue Scott | -- | First American Title | |
| Gardiner Paul K | -- | None Available | |
| Gardiner Paul K | -- | First American Title | |
| Gardiner Paul K | -- | First American Lenders Title | |
| Gardiner Paul K | -- | -- | |
| Gardiner Paul K | -- | -- |
Source: Public Records
Mortgage History
| Date | Status | Borrower | Loan Amount |
|---|---|---|---|
| Open | Blue Scott | $570,216 | |
| Previous Owner | Gardiner Paul K | $30,000 |
Source: Public Records
Tax History Compared to Growth
Tax History
| Year | Tax Paid | Tax Assessment Tax Assessment Total Assessment is a certain percentage of the fair market value that is determined by local assessors to be the total taxable value of land and additions on the property. | Land | Improvement |
|---|---|---|---|---|
| 2025 | $251 | $509,611 | $195,826 | $313,785 |
| 2024 | $219 | $274,449 | $107,704 | $166,745 |
| 2023 | $3,694 | $279,400 | $107,704 | $171,696 |
| 2022 | $3,570 | $271,150 | $91,279 | $179,871 |
| 2021 | $3,069 | $385,000 | $90,376 | $294,624 |
| 2020 | $2,842 | $329,000 | $70,267 | $258,733 |
| 2019 | $2,712 | $296,000 | $65,231 | $230,769 |
| 2018 | $2,517 | $273,000 | $62,269 | $210,731 |
| 2017 | $2,230 | $227,000 | $62,269 | $164,731 |
| 2016 | $2,117 | $117,340 | $30,967 | $86,373 |
| 2015 | $1,984 | $107,742 | $30,967 | $76,775 |
| 2014 | $1,971 | $105,864 | $28,222 | $77,642 |
Source: Public Records
Map
Nearby Homes
- 1663 Navajo Dr
- 1505 Navajo Dr
- 1681 E Lakeview Way
- 1762 Whispering Oaks Dr
- 1303 Sunset Ct Unit 308
- 5142 Sunset Way Unit 401
- 4781 Canterbury Rd
- 5135 Sunset Way Unit 410
- 1302 Sunset Ct
- 1295 Sunset Ct Unit 307
- 1860 Wasatch Dr
- 1370 E 5150 S
- 1811 Shadow Valley Dr
- 5056 Skyline Pkwy
- 1314 E 5250 S
- 1880 Shadow Valley Dr
- 1788 E Seven Oaks Ln
- 5544 S 1425 E
- 4983 Quail Ln
- 5210 Skyline Pkwy
- 5066 Fillmore Ave
- 1591 Navajo Dr
- 5047 Shawnee Ln
- 5063 Shawnee Ln
- 1597 Navajo Dr
- 5080 Fillmore Ave
- 5055 Fillmore Ave
- 5039 Fillmore Ave
- 5079 Shawnee Ln
- 5069 Fillmore Ave
- 5094 Fillmore Ave
- 1586 Navajo Dr
- 1592 Navajo Dr
- 5083 Fillmore Ave
- 5091 Shawnee Ln
- 1572 Navajo Dr
- 5058 Shawnee Ln
- 5048 Shawnee Ln
- 5074 Shawnee Ave
- 1606 Navajo Dr