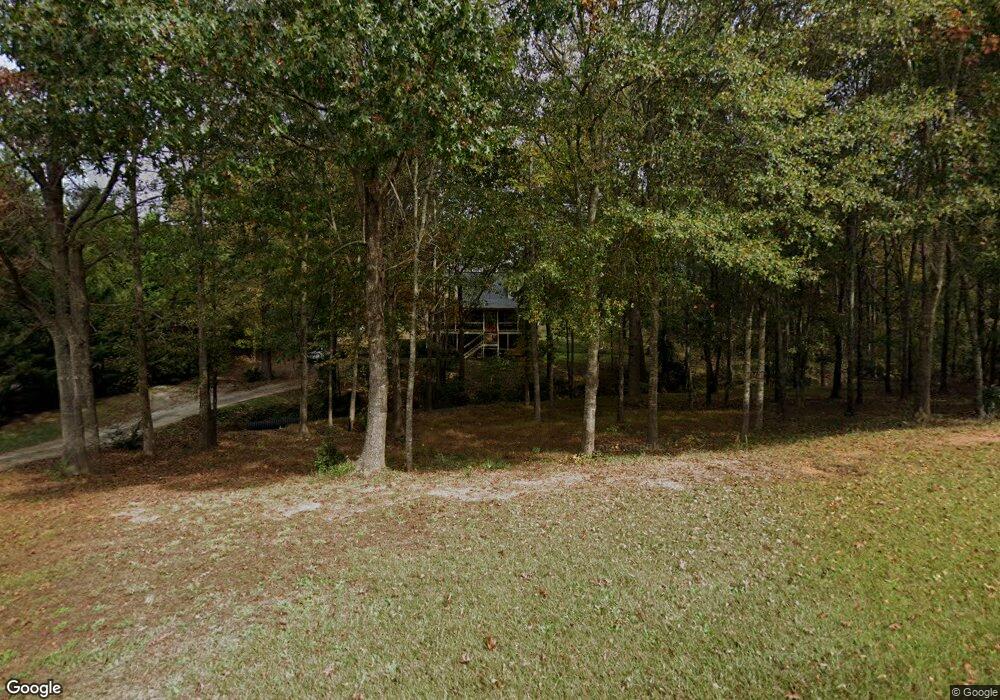
5053 Eagles Nest Ct Unit 3 Loganville, GA 30052
Estimated Value: $289,000 - $334,000
--
Bed
1
Bath
1,482
Sq Ft
$215/Sq Ft
Est. Value
About This Home
This home is located at 5053 Eagles Nest Ct Unit 3, Loganville, GA 30052 and is currently estimated at $318,035, approximately $214 per square foot. 5053 Eagles Nest Ct Unit 3 is a home located in Walton County with nearby schools including Loganville Elementary School, Loganville Middle School, and Loganville High School.
Ownership History
Date
Name
Owned For
Owner Type
Purchase Details
Closed on
Nov 23, 2007
Sold by
Hud
Bought by
Viovod Nadezhda A
Current Estimated Value
Home Financials for this Owner
Home Financials are based on the most recent Mortgage that was taken out on this home.
Original Mortgage
$120,000
Outstanding Balance
$75,296
Interest Rate
6.22%
Mortgage Type
New Conventional
Estimated Equity
$242,739
Purchase Details
Closed on
May 1, 2007
Sold by
Scott Kendra
Bought by
Citimortgage Inc
Purchase Details
Closed on
Mar 24, 2000
Sold by
Truitt Stephen L and Truitt Julie H
Bought by
Scott Kendra
Home Financials for this Owner
Home Financials are based on the most recent Mortgage that was taken out on this home.
Original Mortgage
$109,350
Interest Rate
8.34%
Mortgage Type
FHA
Purchase Details
Closed on
Aug 31, 1995
Sold by
Dannon Homes Inc
Bought by
Johnston Jeffrey Michelle
Purchase Details
Closed on
Mar 23, 1995
Sold by
Walton Homes In C
Bought by
Truitt Stephen L Julie H
Create a Home Valuation Report for This Property
The Home Valuation Report is an in-depth analysis detailing your home's value as well as a comparison with similar homes in the area
Home Values in the Area
Average Home Value in this Area
Purchase History
| Date | Buyer | Sale Price | Title Company |
|---|---|---|---|
| Viovod Nadezhda A | -- | -- | |
| Citimortgage Inc | $129,747 | -- | |
| Scott Kendra | $109,900 | -- | |
| Johnston Jeffrey Michelle | $100,000 | -- | |
| Truitt Stephen L Julie H | $89,900 | -- |
Source: Public Records
Mortgage History
| Date | Status | Borrower | Loan Amount |
|---|---|---|---|
| Open | Viovod Nadezhda A | $120,000 | |
| Previous Owner | Scott Kendra | $109,350 | |
| Closed | Truitt Stephen L Julie H | $0 |
Source: Public Records
Tax History Compared to Growth
Tax History
| Year | Tax Paid | Tax Assessment Tax Assessment Total Assessment is a certain percentage of the fair market value that is determined by local assessors to be the total taxable value of land and additions on the property. | Land | Improvement |
|---|---|---|---|---|
| 2024 | $2,484 | $109,280 | $20,400 | $88,880 |
| 2023 | $2,541 | $106,480 | $20,400 | $86,080 |
| 2022 | $2,581 | $100,200 | $16,600 | $83,600 |
| 2021 | $2,128 | $73,920 | $14,800 | $59,120 |
| 2020 | $2,079 | $69,120 | $12,000 | $57,120 |
| 2019 | $2,003 | $60,360 | $11,200 | $49,160 |
| 2018 | $1,881 | $60,360 | $11,200 | $49,160 |
| 2017 | $1,963 | $56,960 | $10,400 | $46,560 |
| 2016 | $1,782 | $54,280 | $10,400 | $43,880 |
| 2015 | $1,321 | $39,320 | $8,000 | $31,320 |
| 2014 | $1,257 | $36,600 | $0 | $0 |
Source: Public Records
Map
Nearby Homes
- 5063 Eagles Nest Ct
- 5043 Eagles Nest Ct
- 5073 Eagles Nest Ct
- 5022 Cliff Top Dr
- 5032 Cliff Top Dr
- 5012 Cliff Top Dr
- 5054 Eagles Nest Ct
- 5064 Eagles Nest Ct
- 5033 Eagles Nest Ct
- 5044 Eagles Nest Ct Unit 3
- 5042 Cliff Top Dr
- 5074 Eagles Nest Ct
- 5002 Cliff Top Dr
- 5083 Eagles Nest Ct Unit 3
- 5034 Eagles Nest Ct Unit 3
- 5023 Eagles Nest Ct Unit 3
- 5084 Eagles Nest Ct
- 5024 Eagles Nest Ct Unit 3
- 5052 Cliff Top Dr Unit 4
- 5093 Eagles Nest Ct Unit Ga1259