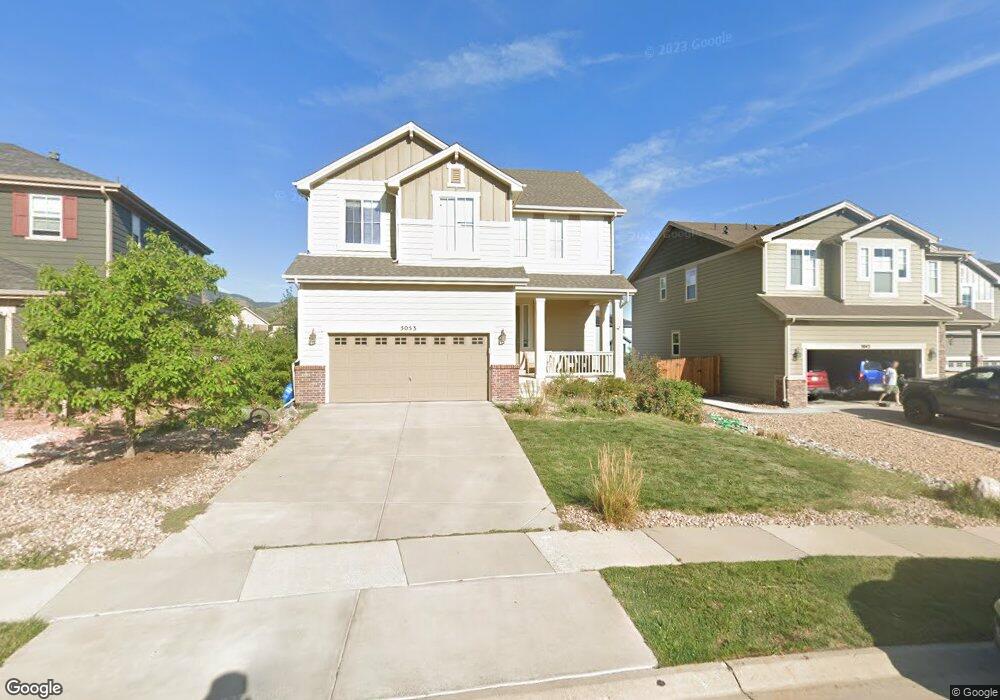
5053 S Beech Way Morrison, CO 80465
Estimated Value: $816,000 - $878,000
3
Beds
4
Baths
2,895
Sq Ft
$293/Sq Ft
Est. Value
About This Home
This home is located at 5053 S Beech Way, Morrison, CO 80465 and is currently estimated at $848,054, approximately $292 per square foot. 5053 S Beech Way is a home located in Jefferson County with nearby schools including Kendallvue Elementary School, Carmody Middle School, and Bear Creek High School.
Ownership History
Date
Name
Owned For
Owner Type
Purchase Details
Closed on
Jan 6, 2020
Sold by
Brooks Amanda and Mclatchie David
Bought by
Mceriane Joseph Charles and Matarazzo Miccah
Current Estimated Value
Home Financials for this Owner
Home Financials are based on the most recent Mortgage that was taken out on this home.
Original Mortgage
$595,700
Outstanding Balance
$526,325
Interest Rate
3.6%
Mortgage Type
VA
Estimated Equity
$321,729
Purchase Details
Closed on
Jul 13, 2016
Sold by
Hurt Joseph R and Vu Thuy Nga
Bought by
Brooks Amanda and Mclatchie David
Home Financials for this Owner
Home Financials are based on the most recent Mortgage that was taken out on this home.
Original Mortgage
$393,600
Interest Rate
3.66%
Mortgage Type
New Conventional
Purchase Details
Closed on
Sep 13, 2011
Sold by
Red Rocks Pointe Llc
Bought by
Hurt Joseph R and Vu Thuy Nga
Home Financials for this Owner
Home Financials are based on the most recent Mortgage that was taken out on this home.
Original Mortgage
$221,908
Interest Rate
4.43%
Mortgage Type
New Conventional
Create a Home Valuation Report for This Property
The Home Valuation Report is an in-depth analysis detailing your home's value as well as a comparison with similar homes in the area
Home Values in the Area
Average Home Value in this Area
Purchase History
| Date | Buyer | Sale Price | Title Company |
|---|---|---|---|
| Mceriane Joseph Charles | $575,000 | Heritage Title Company | |
| Brooks Amanda | $492,000 | Land Title Guarantee Company | |
| Hurt Joseph R | $336,908 | First American |
Source: Public Records
Mortgage History
| Date | Status | Borrower | Loan Amount |
|---|---|---|---|
| Open | Mceriane Joseph Charles | $595,700 | |
| Previous Owner | Brooks Amanda | $393,600 | |
| Previous Owner | Hurt Joseph R | $221,908 |
Source: Public Records
Tax History Compared to Growth
Tax History
| Year | Tax Paid | Tax Assessment Tax Assessment Total Assessment is a certain percentage of the fair market value that is determined by local assessors to be the total taxable value of land and additions on the property. | Land | Improvement |
|---|---|---|---|---|
| 2024 | $5,320 | $54,321 | $13,786 | $40,535 |
| 2023 | $5,320 | $54,321 | $13,786 | $40,535 |
| 2022 | $4,928 | $48,431 | $13,416 | $35,015 |
| 2021 | $4,986 | $49,824 | $13,802 | $36,022 |
| 2020 | $4,159 | $41,669 | $11,169 | $30,500 |
| 2019 | $4,115 | $41,669 | $11,169 | $30,500 |
| 2018 | $3,619 | $35,424 | $11,342 | $24,082 |
| 2017 | $3,305 | $35,424 | $11,342 | $24,082 |
| 2016 | $3,368 | $34,801 | $8,851 | $25,950 |
| 2015 | $3,060 | $34,801 | $8,851 | $25,950 |
| 2014 | $3,060 | $29,634 | $8,245 | $21,389 |
Source: Public Records
Map
Nearby Homes
- 5005 S Cole Ct
- 5005 S Braun St
- 13676 W Grand Dr
- 5400 S Alkire St
- Eton Plan at Three Hills - Single Family Homes
- Kaya Plan at Three Hills - Single Family Homes
- Grafton Plan at Three Hills - Single Family Homes
- Rowe Plan at Three Hills - Single Family Homes
- 4816 S Zang Way
- 13018 W Marlowe Ave
- 12650 W Belmont Ave
- 5641 S Deframe St
- 14472 Tranquil Ct
- 4557 S Coors St
- 4899 N Daven Rd
- 14519 Dove Song Ct
- 4888 Noris Ave
- 14497 Saint Place
- 4885 Noris Ave
- 4436 S Eldridge St
- 5043 S Beech Way
- 5063 S Beech Way
- 5073 S Beech Way
- 13402 W Bellwood Ave
- 13401 W Bellwood Ave
- 13490 W Grand Place
- 13520 W Grand Place
- 13391 W Bellwood Ave
- 13560 W Grand Place
- 13570 W Grand Place
- 13381 W Bellwood Ave
- 13590 W Grand Place
- 13499 W Grand Place
- 13361 W Bellwood Ave
- 13509 W Grand Place
- 13341 W Bellwood Ave
- 13379 W Grand Place
- 13519 W Grand Place
- 13569 W Grand Place
- 13428 W Grand Dr