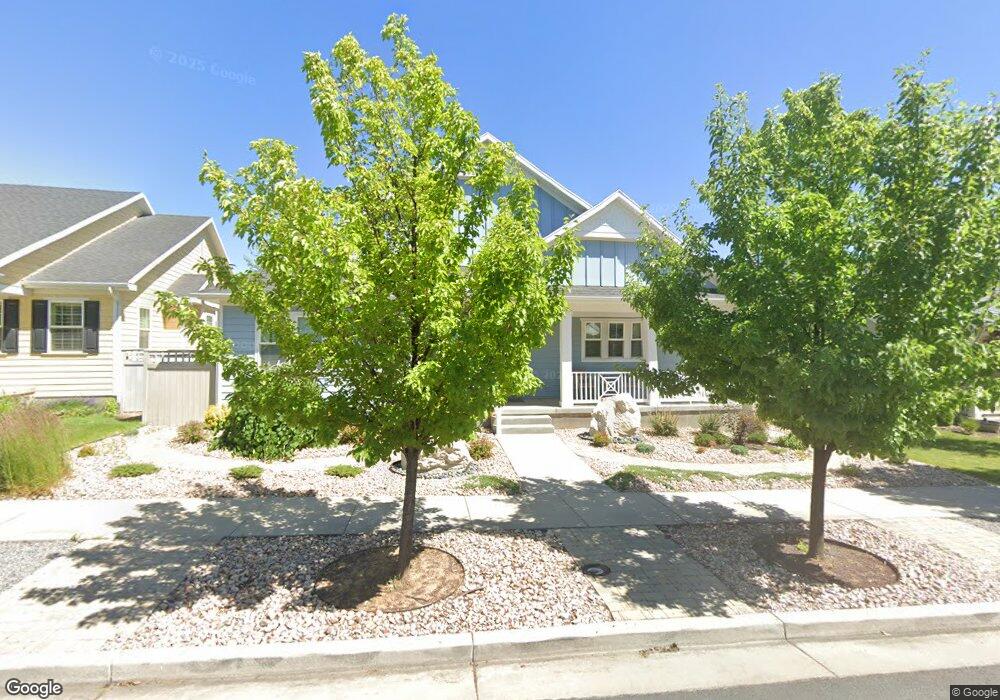
5054 W Bowstring Way Unit 9-318 South Jordan, UT 84009
Daybreak NeighborhoodEstimated Value: $789,000 - $886,137
6
Beds
3
Baths
3,631
Sq Ft
$229/Sq Ft
Est. Value
About This Home
This home is located at 5054 W Bowstring Way Unit 9-318, South Jordan, UT 84009 and is currently estimated at $830,284, approximately $228 per square foot. 5054 W Bowstring Way Unit 9-318 is a home located in Salt Lake County with nearby schools including Golden Fields Elementary School, Mountain Creek Middle School, and Herriman High School.
Ownership History
Date
Name
Owned For
Owner Type
Purchase Details
Closed on
Mar 31, 2021
Sold by
Pelz Jack Warren and Pelz Patricia Ann
Bought by
Pelz Jack Warren and Pelz Patricia Ann
Current Estimated Value
Purchase Details
Closed on
Aug 20, 2020
Sold by
Beutler Gary J and Beutler Beth
Bought by
Pelz Patricia Ann and Pelz Jack Warren
Home Financials for this Owner
Home Financials are based on the most recent Mortgage that was taken out on this home.
Original Mortgage
$480,000
Outstanding Balance
$425,794
Interest Rate
3%
Mortgage Type
New Conventional
Estimated Equity
$404,490
Purchase Details
Closed on
Apr 7, 2014
Sold by
Bangerter Homes Llc
Bought by
Beutler Gary J and Beutler Beth
Home Financials for this Owner
Home Financials are based on the most recent Mortgage that was taken out on this home.
Original Mortgage
$91,000
Interest Rate
4.3%
Mortgage Type
New Conventional
Create a Home Valuation Report for This Property
The Home Valuation Report is an in-depth analysis detailing your home's value as well as a comparison with similar homes in the area
Home Values in the Area
Average Home Value in this Area
Purchase History
| Date | Buyer | Sale Price | Title Company |
|---|---|---|---|
| Pelz Jack Warren | -- | None Available | |
| Pelz Patricia Ann | -- | Meridian Title | |
| Beutler Gary J | -- | Metro National Title |
Source: Public Records
Mortgage History
| Date | Status | Borrower | Loan Amount |
|---|---|---|---|
| Open | Pelz Patricia Ann | $480,000 | |
| Previous Owner | Beutler Gary J | $91,000 |
Source: Public Records
Tax History Compared to Growth
Tax History
| Year | Tax Paid | Tax Assessment Tax Assessment Total Assessment is a certain percentage of the fair market value that is determined by local assessors to be the total taxable value of land and additions on the property. | Land | Improvement |
|---|---|---|---|---|
| 2025 | $4,460 | $854,600 | $105,000 | $749,600 |
| 2024 | $4,460 | $846,900 | $102,000 | $744,900 |
| 2023 | $4,631 | $829,600 | $99,000 | $730,600 |
| 2022 | $4,776 | $838,600 | $97,100 | $741,500 |
| 2021 | $3,898 | $628,000 | $74,800 | $553,200 |
| 2020 | $3,587 | $541,700 | $70,500 | $471,200 |
| 2019 | $3,552 | $527,200 | $70,500 | $456,700 |
| 2018 | $3,421 | $505,300 | $69,400 | $435,900 |
| 2017 | $3,315 | $479,800 | $69,400 | $410,400 |
| 2016 | $3,389 | $464,800 | $69,400 | $395,400 |
| 2015 | -- | $471,700 | $84,000 | $387,700 |
| 2014 | $2,484 | $325,500 | $99,100 | $226,400 |
Source: Public Records
Map
Nearby Homes
- 10421 S Split Rock Dr
- 5023 S Jordan Pkwy W
- 4881 S Jordan Pkwy W
- 5239 W Bowstring Way Unit 518
- 4801 W South Jordan Pkwy
- 10572 S Kestrel Rise Rd
- 5261 W Bowstring Way
- 10617 S Split Rock Dr
- 4966 W Kitsap Way Unit 10-532
- 11381 S Watercourse Rd Unit 205
- 4821 W Dock St
- 5248 W South Jordan Pkwy
- 5262 S Jordan Pkwy W
- 10566 S Lake Ave
- 4722 W Noyo Ln
- 4712 W South Jordan Pkwy
- 4722 W Vermillion Dr
- 10606 S Redknife Dr
- 10308 S Rubicon Rd
- 5371 W Bowstring Way
- 5054 W Bowstring Way
- 5064 W Bowstring Way
- 5046 W Bowstring Way Unit 9-319
- 5046 W Bowstring Way
- 5059 W Burntside Ave
- 5034 Bowstring Way Unit 9-320
- 5069 W Burntside Ave
- 5074 W Bowstring Way
- 5047 W Burntside Ave
- 5051 W Bowstring Way Unit 9-325
- 5051 W Bowstring Way
- 5079 W Burntside Ave
- 5067 W Bowstring Way
- 5043 W Bowstring Way Unit 9-324
- 5043 W Bowstring Way
- 11358 S Aqua St Unit 3-227
- 6831 W Docksider Dr Unit 3-241
- 5037 W Bowstring Way Unit 9-323
- 5037 W Bowstring Way
- 5033 W Burntside Drive Dr S