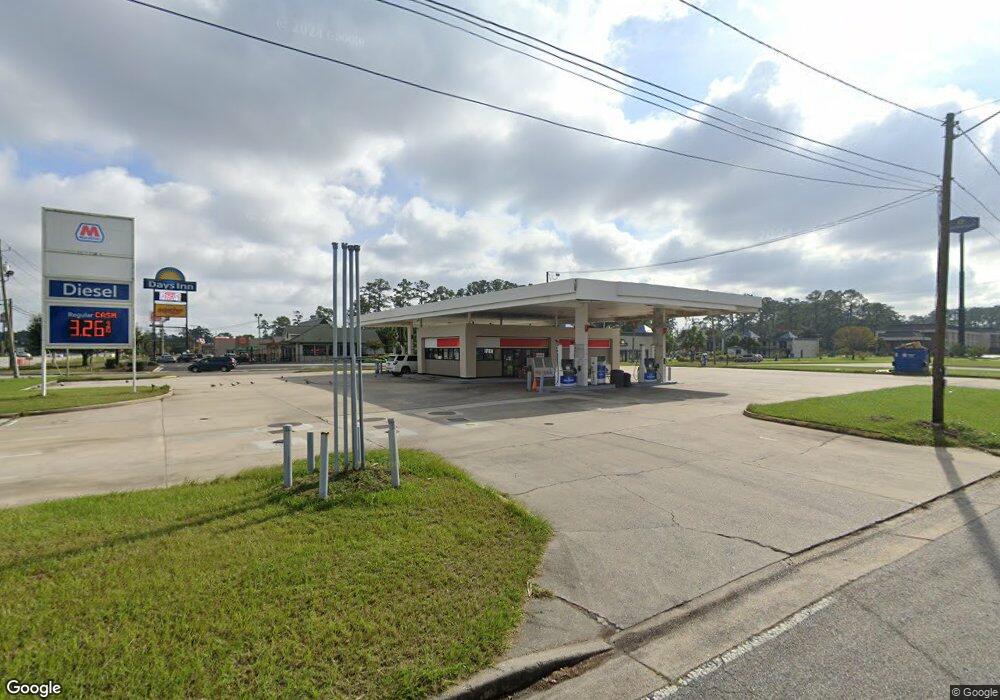
5055 New Jesup Hwy Brunswick, GA 31520
Estimated Value: $1,551,710
--
Bed
--
Bath
1,200
Sq Ft
$1,293/Sq Ft
Est. Value
About This Home
This home is located at 5055 New Jesup Hwy, Brunswick, GA 31520 and is currently priced at $1,551,710, approximately $1,293 per square foot. 5055 New Jesup Hwy is a home located in Glynn County with nearby schools including Glyndale Elementary School, Glynn Middle School, and Glynn Academy.
Ownership History
Date
Name
Owned For
Owner Type
Purchase Details
Closed on
Aug 19, 2024
Sold by
Mayur & Tamilton Corp
Bought by
Aadyashakti Llc
Current Estimated Value
Home Financials for this Owner
Home Financials are based on the most recent Mortgage that was taken out on this home.
Original Mortgage
$492,915
Outstanding Balance
$326,317
Interest Rate
6.77%
Mortgage Type
New Conventional
Purchase Details
Closed on
May 10, 2016
Sold by
Exxon 36 Inc
Bought by
Mayur & Tamilton Corp
Home Financials for this Owner
Home Financials are based on the most recent Mortgage that was taken out on this home.
Original Mortgage
$600,000
Interest Rate
3.58%
Mortgage Type
Commercial
Purchase Details
Closed on
Feb 19, 2014
Sold by
Lee Kyung Sun
Bought by
Exxon 36 Inc
Home Financials for this Owner
Home Financials are based on the most recent Mortgage that was taken out on this home.
Original Mortgage
$300,000
Interest Rate
4.43%
Mortgage Type
Commercial
Create a Home Valuation Report for This Property
The Home Valuation Report is an in-depth analysis detailing your home's value as well as a comparison with similar homes in the area
Home Values in the Area
Average Home Value in this Area
Purchase History
| Date | Buyer | Sale Price | Title Company |
|---|---|---|---|
| Aadyashakti Llc | $466,105 | -- | |
| Mayur & Tamilton Corp | $750,000 | -- | |
| Exxon 36 Inc | -- | -- | |
| Exxon 36 Inc | $490,000 | -- |
Source: Public Records
Mortgage History
| Date | Status | Borrower | Loan Amount |
|---|---|---|---|
| Open | Aadyashakti Llc | $492,915 | |
| Previous Owner | Mayur & Tamilton Corp | $600,000 | |
| Previous Owner | Exxon 36 Inc | $300,000 |
Source: Public Records
Tax History Compared to Growth
Tax History
| Year | Tax Paid | Tax Assessment Tax Assessment Total Assessment is a certain percentage of the fair market value that is determined by local assessors to be the total taxable value of land and additions on the property. | Land | Improvement |
|---|---|---|---|---|
| 2025 | $5,047 | $201,240 | $119,840 | $81,400 |
| 2024 | $5,047 | $201,258 | $119,840 | $81,418 |
| 2023 | $4,946 | $201,258 | $119,840 | $81,418 |
| 2022 | $5,047 | $201,258 | $119,840 | $81,418 |
| 2021 | $5,205 | $201,258 | $119,840 | $81,418 |
| 2020 | $5,255 | $201,258 | $119,840 | $81,418 |
| 2019 | $5,255 | $201,258 | $119,840 | $81,418 |
| 2018 | $5,255 | $201,258 | $119,840 | $81,418 |
| 2017 | $5,255 | $201,258 | $119,840 | $81,418 |
| 2016 | $4,392 | $183,018 | $119,840 | $63,178 |
| 2015 | $2,396 | $183,018 | $119,840 | $63,178 |
| 2014 | $2,396 | $99,408 | $52,430 | $46,978 |
Source: Public Records
Map
Nearby Homes
- 450 Warren Mason Blvd
- 93 Brook Dr
- 300 Butler Dr
- 304 Butler Dr
- 511 Butler Dr
- 243 Glen Meadows Cir
- 133 Yellow Bluff Ln
- 210 Glen Meadows Cir
- 130 Stately Oaks Cir
- 165 Pine Cir
- 148 Merritt Cir
- 150 Merritt Cir
- 146 Merritt Cir
- 145 Merritt Cir
- 151 Merritt Cir
- 147 Merritt Cir
- 149 Merritt Cir
- 1037 Lake Dr
- 1013 Lake Dr
- 1030 Lake Dr
- 0 Tourist Dr
- 5043 New Jesup Hwy
- 5060 New Jesup Hwy
- 5012 New Jesup Hwy
- 5028 New Jesup Hwy
- 5020 New Jesup Hwy
- 0 Glyndale Cir Unit 1586209
- 0 Glyndale Cir Unit 7A Block D 8285075
- 0 Glyndale Cir Unit 7A Block D 8526371
- 63 Glyndale Cir
- 5010 New Jesup Hwy
- 113 Glyndale Cir
- 113 Glyndale Cir
- 5004 New Jesup Hwy
- 62 Glyndale Cir
- 3040 Scarlett St
- 0 Glyndale Dr
- 115 Glyndale Cir
- 110 Glyndale Cir
- 107 Glyndale Cir