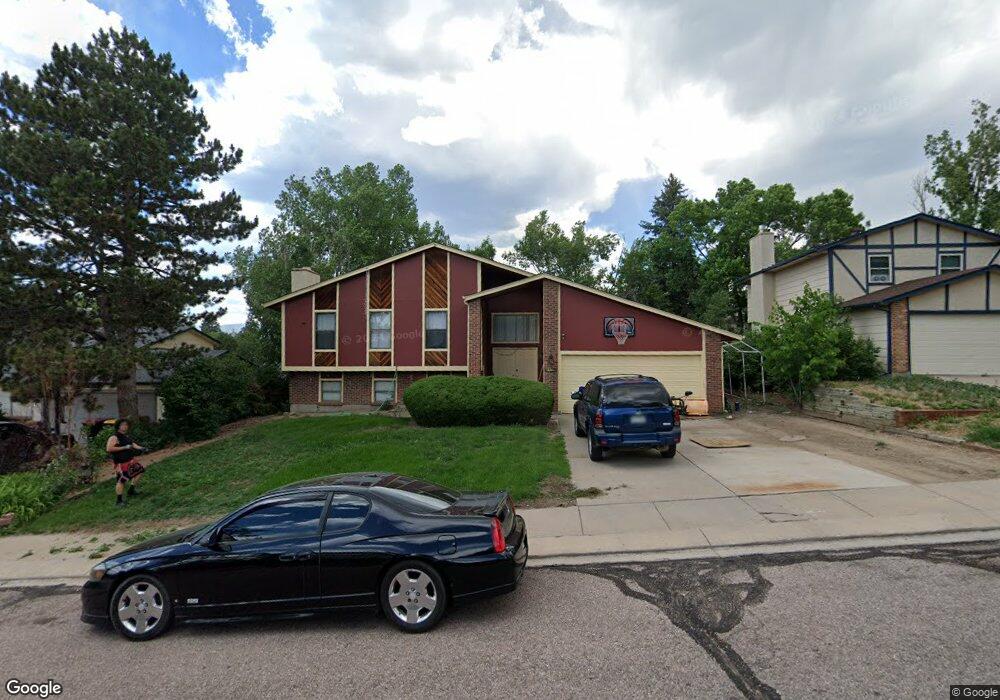
5057 Harvest Rd Colorado Springs, CO 80917
Old Farms NeighborhoodEstimated Value: $403,559 - $453,000
4
Beds
2
Baths
1,088
Sq Ft
$391/Sq Ft
Est. Value
About This Home
This home is located at 5057 Harvest Rd, Colorado Springs, CO 80917 and is currently estimated at $425,890, approximately $391 per square foot. 5057 Harvest Rd is a home located in El Paso County with nearby schools including Scott Elementary School, Jenkins Middle School, and Doherty High School.
Ownership History
Date
Name
Owned For
Owner Type
Purchase Details
Closed on
Sep 19, 2025
Sold by
Trusskey Charlotte Delphine and Driggers Mark
Bought by
Driggers Mark
Current Estimated Value
Home Financials for this Owner
Home Financials are based on the most recent Mortgage that was taken out on this home.
Original Mortgage
$105,820
Outstanding Balance
$105,820
Interest Rate
6.58%
Mortgage Type
FHA
Estimated Equity
$320,070
Purchase Details
Closed on
Aug 5, 2002
Sold by
Trusskey Charlotte and Driggers Mark L
Bought by
Trusskey Charlotte
Purchase Details
Closed on
Jun 21, 1996
Sold by
In Kim Chong and Ok Myong Ok
Bought by
Kennedy Jerry A and Kennedy Elizabeth A
Home Financials for this Owner
Home Financials are based on the most recent Mortgage that was taken out on this home.
Original Mortgage
$119,019
Interest Rate
8.24%
Mortgage Type
FHA
Purchase Details
Closed on
Feb 1, 1983
Bought by
Trusskey Charlotte
Create a Home Valuation Report for This Property
The Home Valuation Report is an in-depth analysis detailing your home's value as well as a comparison with similar homes in the area
Home Values in the Area
Average Home Value in this Area
Purchase History
| Date | Buyer | Sale Price | Title Company |
|---|---|---|---|
| Driggers Mark | -- | None Listed On Document | |
| Trusskey Charlotte | -- | Stewart Title | |
| Trusskey Charlotte | $180,000 | Stewart Title | |
| Kennedy Jerry A | $120,000 | -- | |
| Trusskey Charlotte | -- | -- |
Source: Public Records
Mortgage History
| Date | Status | Borrower | Loan Amount |
|---|---|---|---|
| Open | Driggers Mark | $105,820 | |
| Previous Owner | Kennedy Jerry A | $119,019 |
Source: Public Records
Tax History Compared to Growth
Tax History
| Year | Tax Paid | Tax Assessment Tax Assessment Total Assessment is a certain percentage of the fair market value that is determined by local assessors to be the total taxable value of land and additions on the property. | Land | Improvement |
|---|---|---|---|---|
| 2025 | $1,404 | $29,740 | -- | -- |
| 2024 | $1,290 | $29,690 | $5,490 | $24,200 |
| 2023 | $1,290 | $29,690 | $5,490 | $24,200 |
| 2022 | $1,248 | $22,300 | $4,170 | $18,130 |
| 2021 | $1,354 | $22,940 | $4,290 | $18,650 |
| 2020 | $1,368 | $20,160 | $3,720 | $16,440 |
| 2019 | $1,361 | $20,160 | $3,720 | $16,440 |
| 2018 | $1,266 | $17,260 | $3,240 | $14,020 |
| 2017 | $1,199 | $17,260 | $3,240 | $14,020 |
| 2016 | $930 | $16,050 | $2,710 | $13,340 |
| 2015 | $927 | $16,050 | $2,710 | $13,340 |
| 2014 | $903 | $15,000 | $2,710 | $12,290 |
Source: Public Records
Map
Nearby Homes
- 4958 Wood Brook Ct
- 4835 W Old Farm Cir
- 5119 Lewisia Point
- 5125 Lewisia Point
- 4878 S Old Brook Cir
- 4966 Galileo Dr
- 5242 Windgate Ct
- 4842 S Old Brook Cir
- 4774 Bunchberry Ln
- 5235 Quasar Ct
- 4955 Chickweed Dr
- 5050 Copernicus Way
- 5081 Willowbrook Rd
- 5485 Castilian Villas Point
- 4636 Winewood Village Dr
- 5441 E Old Farm Cir
- 0 Copper Dr Unit 2206120
- 4671 Winewood Village Dr Unit X4671
- 4652 Excalibur Ct
- 5162 Sunset Ridge Dr
- 5049 Harvest Rd
- 5065 Harvest Rd
- 5035 Horseshoe Bend St
- 5025 Horseshoe Bend St
- 5045 Horseshoe Bend St
- 5041 Harvest Rd
- 5073 Harvest Rd
- 5048 Harvest Rd
- 5056 Harvest Rd
- 5055 Horseshoe Bend St
- 5040 Harvest Rd
- 5064 Harvest Rd
- 5081 Harvest Rd
- 4999 Horseshoe Bend St
- 5032 Harvest Rd
- 5065 Horseshoe Bend St
- 5072 Harvest Rd
- 4966 Wood Brook Ct
- 5030 Horseshoe Bend St
- 5025 Harvest Rd