Estimated Value: $381,000 - $404,906
3
Beds
1
Bath
958
Sq Ft
$410/Sq Ft
Est. Value
About This Home
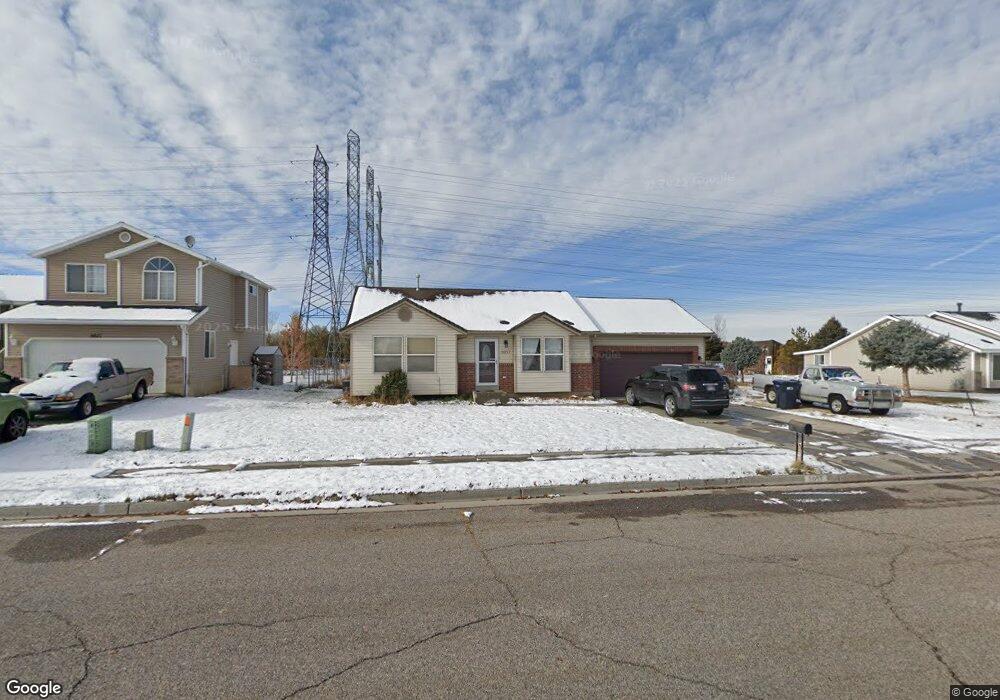
This home is located at 5057 S 3200 W Unit 24, Roy, UT 84067 and is currently estimated at $392,477, approximately $409 per square foot. 5057 S 3200 W Unit 24 is a home located in Weber County with nearby schools including Midland School, Sand Ridge Junior High School, and Roy High School.
Ownership History
Date
Name
Owned For
Owner Type
Purchase Details
Closed on
Jul 25, 2013
Sold by
Hinds Joshua I and Hinds Candice D
Bought by
Wilkinson Nathan and Wilkinson Teresa
Current Estimated Value
Home Financials for this Owner
Home Financials are based on the most recent Mortgage that was taken out on this home.
Original Mortgage
$148,117
Outstanding Balance
$107,976
Interest Rate
3.98%
Mortgage Type
VA
Estimated Equity
$284,501
Purchase Details
Closed on
Dec 19, 2002
Sold by
Eborn Harold and Karras Allan
Bought by
Cliff Bell Construction Inc
Home Financials for this Owner
Home Financials are based on the most recent Mortgage that was taken out on this home.
Original Mortgage
$85,520
Interest Rate
5.86%
Create a Home Valuation Report for This Property
The Home Valuation Report is an in-depth analysis detailing your home's value as well as a comparison with similar homes in the area
Home Values in the Area
Average Home Value in this Area
Purchase History
| Date | Buyer | Sale Price | Title Company |
|---|---|---|---|
| Wilkinson Nathan | -- | Backman Title Services Ltd | |
| Cliff Bell Construction Inc | -- | Mountain View Title |
Source: Public Records
Mortgage History
| Date | Status | Borrower | Loan Amount |
|---|---|---|---|
| Open | Wilkinson Nathan | $148,117 | |
| Previous Owner | Cliff Bell Construction Inc | $85,520 |
Source: Public Records
Tax History Compared to Growth
Tax History
| Year | Tax Paid | Tax Assessment Tax Assessment Total Assessment is a certain percentage of the fair market value that is determined by local assessors to be the total taxable value of land and additions on the property. | Land | Improvement |
|---|---|---|---|---|
| 2025 | $279 | $370,309 | $152,066 | $218,243 |
| 2024 | $272 | $200,750 | $83,644 | $117,106 |
| 2023 | $263 | $191,401 | $69,944 | $121,457 |
| 2022 | $1,009 | $218,350 | $64,502 | $153,848 |
| 2021 | $417 | $283,000 | $87,460 | $195,540 |
| 2020 | $255 | $255,000 | $87,460 | $167,540 |
| 2019 | $201 | $228,000 | $51,025 | $176,975 |
| 2018 | $0 | $197,000 | $45,929 | $151,071 |
| 2017 | $1,478 | $163,000 | $45,929 | $117,071 |
| 2016 | $1,442 | $85,718 | $24,227 | $61,491 |
| 2015 | $1,287 | $77,564 | $24,227 | $53,337 |
| 2014 | $1,153 | $67,521 | $24,227 | $43,294 |
Source: Public Records
Map
Nearby Homes
- 4964 S 3375 W
- 5009 S 2925 W
- 5321 S 3100 W
- 3443 W 5200 S Unit 2&3
- 3046 W 4850 S
- 4918 S 2925 W
- 3171 W 4725 S
- 5063 S 2825 W
- 5003 S 2825 W
- 3509 W 4835 S Unit 26
- 5432 S 3150 W
- 4891 S 2875 W
- 3523 W 4835 S Unit 28
- 3524 W 4835 S Unit 22
- 5056 S 2800 W
- 3014 W 4750 S
- Poplar Plan at Highgate Cove
- Pando Plan at Highgate Cove
- 5538 S 3150 W
- 3607 W 5400 S
- 5057 S 3200 W
- 5071 S 3200 W
- 5071 S 3200 W Unit 23
- 5043 S 3200 W
- 5083 S 3200 W
- 3194 W 5075 S
- 3194 W 5075 S Unit 1-R
- 5027 S 3200 W
- 3185 W 5025 S
- 3195 W 5075 S Unit 11-R
- 3188 W 5075 S
- 5011 S 3200 W
- 3167 W 5025 S
- 5113 S 3200 W
- 5113 S 3200 W Unit 20
- 5098 S 3200 W
- 3182 W 5075 S
- 5127 S 3200 W
- 5114 S 3200 W
- 4995 S 3200 W