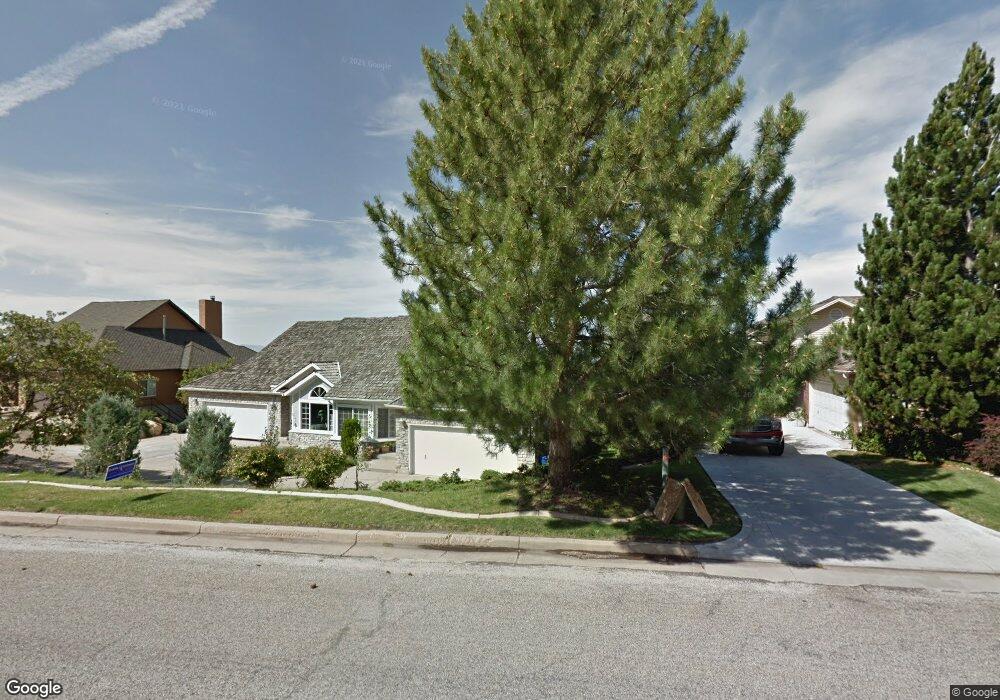
5057 S Ridgedale Dr Ogden, UT 84403
Southeast Ogden NeighborhoodEstimated Value: $548,253 - $683,000
3
Beds
3
Baths
3,280
Sq Ft
$182/Sq Ft
Est. Value
About This Home
This home is located at 5057 S Ridgedale Dr, Ogden, UT 84403 and is currently estimated at $596,563, approximately $181 per square foot. 5057 S Ridgedale Dr is a home located in Weber County with nearby schools including Shadow Valley School, Mount Ogden Junior High School, and Ogden High School.
Ownership History
Date
Name
Owned For
Owner Type
Purchase Details
Closed on
Aug 28, 2024
Sold by
C David And Vicki P Correll Revocable Li and Correll Michael D
Bought by
Courouleau Michael
Current Estimated Value
Home Financials for this Owner
Home Financials are based on the most recent Mortgage that was taken out on this home.
Original Mortgage
$475,260
Outstanding Balance
$470,214
Interest Rate
6.77%
Mortgage Type
New Conventional
Estimated Equity
$126,349
Purchase Details
Closed on
Jul 16, 2021
Sold by
Correll Charles David
Bought by
Correll C David C and Correll David C
Home Financials for this Owner
Home Financials are based on the most recent Mortgage that was taken out on this home.
Original Mortgage
$279,720
Interest Rate
2.96%
Mortgage Type
VA
Purchase Details
Closed on
Jul 17, 2002
Sold by
Correll C David and Correll Vicki P
Bought by
Correll C David
Create a Home Valuation Report for This Property
The Home Valuation Report is an in-depth analysis detailing your home's value as well as a comparison with similar homes in the area
Home Values in the Area
Average Home Value in this Area
Purchase History
| Date | Buyer | Sale Price | Title Company |
|---|---|---|---|
| Courouleau Michael | -- | Metro National Title | |
| Correll C David C | -- | Backman Ntp | |
| Correll Charles David | -- | Backman Ntp | |
| Correll C David | -- | -- |
Source: Public Records
Mortgage History
| Date | Status | Borrower | Loan Amount |
|---|---|---|---|
| Open | Courouleau Michael | $475,260 | |
| Previous Owner | Correll Charles David | $279,720 |
Source: Public Records
Tax History
| Year | Tax Paid | Tax Assessment Tax Assessment Total Assessment is a certain percentage of the fair market value that is determined by local assessors to be the total taxable value of land and additions on the property. | Land | Improvement |
|---|---|---|---|---|
| 2025 | $3,694 | $541,547 | $229,661 | $311,886 |
| 2024 | $3,689 | $292,049 | $126,313 | $165,736 |
| 2023 | $3,589 | $298,650 | $126,314 | $172,336 |
| 2022 | $3,704 | $295,901 | $99,864 | $196,037 |
| 2021 | $3,198 | $462,000 | $105,298 | $356,702 |
| 2020 | $3,053 | $374,000 | $86,605 | $287,395 |
| 2019 | $2,930 | $337,000 | $81,638 | $255,362 |
| 2018 | $2,879 | $329,000 | $72,928 | $256,072 |
| 2017 | $3,007 | $321,000 | $72,928 | $248,072 |
| 2016 | $2,726 | $157,327 | $42,939 | $114,388 |
| 2015 | $2,493 | $140,383 | $42,939 | $97,444 |
| 2014 | $2,539 | $140,363 | $42,939 | $97,424 |
Source: Public Records
Map
Nearby Homes
- 5028 S Ridgedale Dr
- 5210 Skyline Pkwy
- 5155 Mile High Cir
- 4983 Quail Ln
- 4864 Nightingale Ln Unit 71
- 4843 S Nightingale
- 1921 Mohawk Ln
- 4858 Nightingale Ln Unit 72
- 5304 S Skyline Pkwy
- 4849 Nightingale Ln
- 4857 Chukar Ln
- 1860 Wasatch Dr
- 1880 Shadow Valley Dr
- 1762 Whispering Oaks Dr
- 1963 Cherokee Cir
- 1773 Meadow Creek Ln
- 5538 Elderberry Ct
- 4781 Canterbury Rd
- 1644 Wasatch Dr
- 1788 E Seven Oaks Ln
- 5057 Ridgedale Dr
- 5063 Ridgedale Dr
- 5051 Ridgedale Dr
- 5071 Ridgedale Dr
- 5045 Ridgedale Dr
- 5077 Ridgedale Dr
- 5055 Charenton Cove Cir Unit 14
- 5055 Charenton Cove Cir
- 5083 Ridgedale Dr
- 4900 S Ridgedale Dr Unit 4
- 5250 S Ridgedale Dr Unit 4
- 4900 S Ridgedale Dr Unit 5
- 4900 S Ridgedale Dr Unit 3
- 5295 S Ridgedale Dr Unit 15
- 5299 S Ridgedale Dr Unit 17
- 5041 Charenton Cove Cir
- 5075 Charenton Cove Cir
- 5075 Charenton Cove Cir Unit 13
- 5035 Charenton Cove Cir
- 5091 Ridgedale Dr
Your Personal Tour Guide
Ask me questions while you tour the home.