Estimated Value: $453,000 - $493,000
5
Beds
3
Baths
2,946
Sq Ft
$161/Sq Ft
Est. Value
About This Home
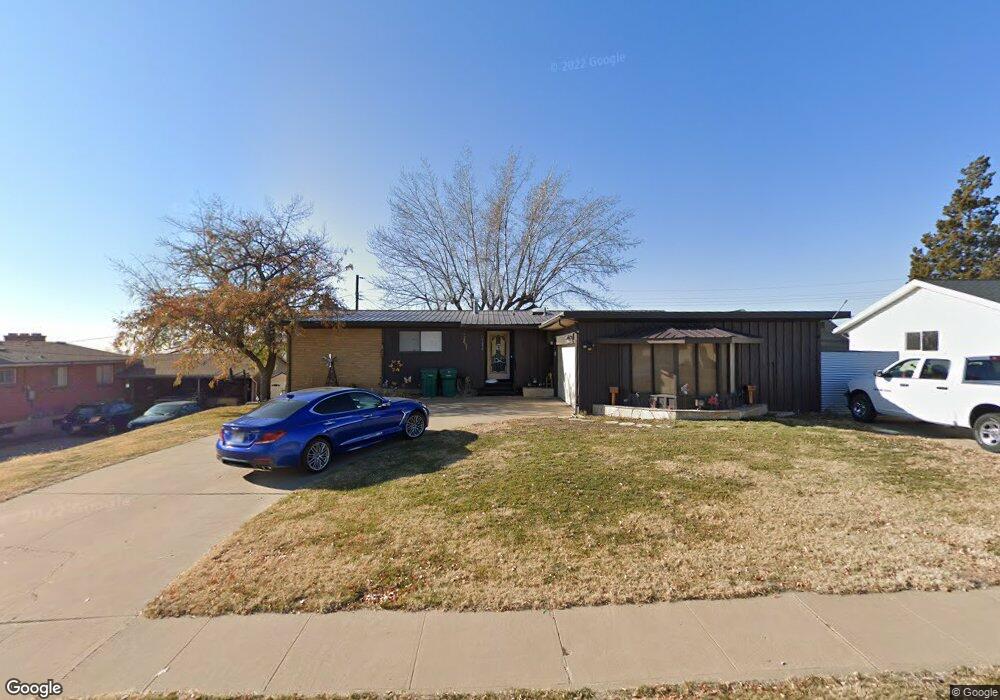
This home is located at 5059 S 2450 W, Roy, UT 84067 and is currently estimated at $473,241, approximately $160 per square foot. 5059 S 2450 W is a home located in Weber County with nearby schools including Lakeview Elementary School, Roy Junior High School, and Roy High School.
Ownership History
Date
Name
Owned For
Owner Type
Purchase Details
Closed on
Sep 6, 2019
Sold by
Price Ken
Bought by
Witcher Aaron and Witcher Justine
Current Estimated Value
Home Financials for this Owner
Home Financials are based on the most recent Mortgage that was taken out on this home.
Original Mortgage
$309,294
Outstanding Balance
$272,206
Interest Rate
4.25%
Mortgage Type
FHA
Estimated Equity
$201,035
Purchase Details
Closed on
Apr 15, 2010
Sold by
Frye Mark W and Frye Teresa A
Bought by
Hoopes Robin L
Home Financials for this Owner
Home Financials are based on the most recent Mortgage that was taken out on this home.
Original Mortgage
$157,102
Interest Rate
5.5%
Mortgage Type
FHA
Purchase Details
Closed on
Jun 16, 2005
Sold by
West William B and West Leonard Paul
Bought by
Frye Mark W and Frye Teresa A
Purchase Details
Closed on
Jul 22, 1992
Sold by
West Leonard A and West Joyce B
Bought by
West William B and West Leonard Paul
Create a Home Valuation Report for This Property
The Home Valuation Report is an in-depth analysis detailing your home's value as well as a comparison with similar homes in the area
Home Values in the Area
Average Home Value in this Area
Purchase History
| Date | Buyer | Sale Price | Title Company |
|---|---|---|---|
| Witcher Aaron | -- | Mountain View Title Ogden | |
| Hoopes Robin L | -- | Backman Ntp | |
| Frye Mark W | -- | Bonneville Title Company Sal | |
| West William B | -- | -- |
Source: Public Records
Mortgage History
| Date | Status | Borrower | Loan Amount |
|---|---|---|---|
| Open | Witcher Aaron | $309,294 | |
| Previous Owner | Hoopes Robin L | $157,102 |
Source: Public Records
Tax History
| Year | Tax Paid | Tax Assessment Tax Assessment Total Assessment is a certain percentage of the fair market value that is determined by local assessors to be the total taxable value of land and additions on the property. | Land | Improvement |
|---|---|---|---|---|
| 2025 | $2,998 | $482,040 | $120,000 | $362,040 |
| 2024 | $2,836 | $251,899 | $66,000 | $185,899 |
| 2023 | $2,711 | $240,900 | $63,153 | $177,747 |
| 2022 | $2,859 | $262,350 | $57,754 | $204,596 |
| 2021 | $2,240 | $336,000 | $69,994 | $266,006 |
| 2020 | $2,007 | $275,000 | $69,994 | $205,006 |
| 2019 | $1,925 | $248,000 | $40,019 | $207,981 |
| 2018 | $1,766 | $213,000 | $37,012 | $175,988 |
| 2017 | $1,651 | $186,000 | $37,012 | $148,988 |
| 2016 | $1,591 | $96,356 | $19,021 | $77,335 |
| 2015 | $1,440 | $88,759 | $19,021 | $69,738 |
| 2014 | $1,328 | $80,068 | $16,160 | $63,908 |
Source: Public Records
Map
Nearby Homes
Your Personal Tour Guide
Ask me questions while you tour the home.