Estimated Value: $398,879 - $427,000
3
Beds
1
Bath
1,308
Sq Ft
$319/Sq Ft
Est. Value
About This Home
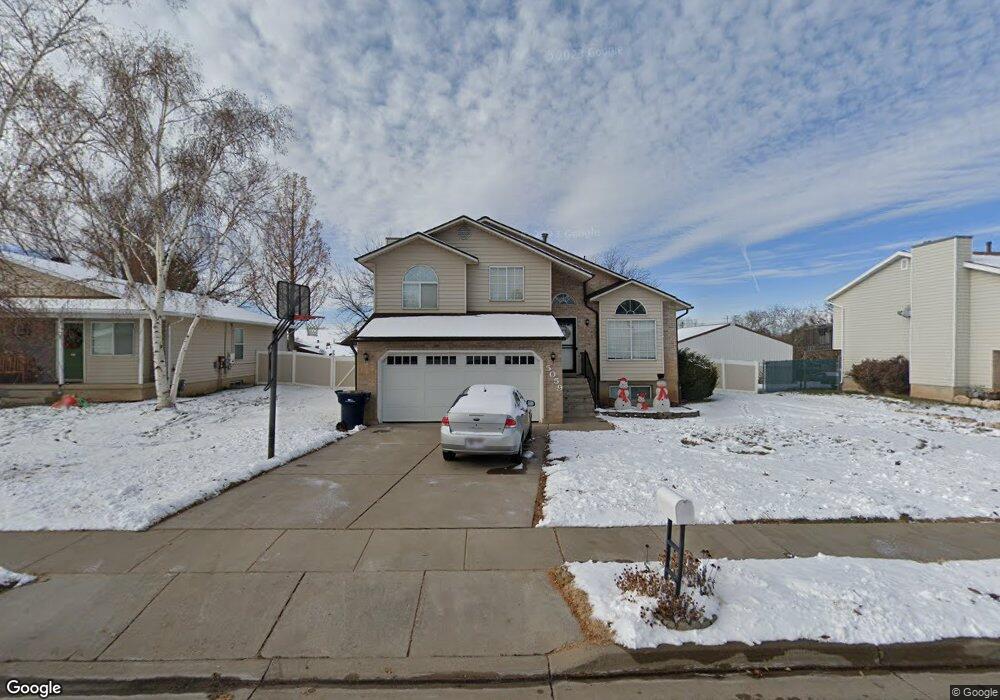
This home is located at 5059 S 3025 W, Roy, UT 84067 and is currently estimated at $416,970, approximately $318 per square foot. 5059 S 3025 W is a home located in Weber County with nearby schools including Midland School, Sand Ridge Junior High School, and Roy High School.
Ownership History
Date
Name
Owned For
Owner Type
Purchase Details
Closed on
Jul 2, 2021
Sold by
Medina Thomas Leonard
Bought by
Neyts Sommer and Butler Timothy G
Current Estimated Value
Home Financials for this Owner
Home Financials are based on the most recent Mortgage that was taken out on this home.
Original Mortgage
$339,500
Outstanding Balance
$308,044
Interest Rate
2.9%
Mortgage Type
New Conventional
Estimated Equity
$108,926
Create a Home Valuation Report for This Property
The Home Valuation Report is an in-depth analysis detailing your home's value as well as a comparison with similar homes in the area
Home Values in the Area
Average Home Value in this Area
Purchase History
| Date | Buyer | Sale Price | Title Company |
|---|---|---|---|
| Neyts Sommer | -- | First Amer Ttl Legend Hill |
Source: Public Records
Mortgage History
| Date | Status | Borrower | Loan Amount |
|---|---|---|---|
| Open | Neyts Sommer | $339,500 |
Source: Public Records
Tax History Compared to Growth
Tax History
| Year | Tax Paid | Tax Assessment Tax Assessment Total Assessment is a certain percentage of the fair market value that is determined by local assessors to be the total taxable value of land and additions on the property. | Land | Improvement |
|---|---|---|---|---|
| 2025 | $2,556 | $404,116 | $135,246 | $268,870 |
| 2024 | $2,448 | $213,949 | $73,947 | $140,002 |
| 2023 | $2,335 | $204,050 | $66,961 | $137,089 |
| 2022 | $2,484 | $224,950 | $56,466 | $168,484 |
| 2021 | $1,980 | $293,000 | $76,971 | $216,029 |
| 2020 | $1,875 | $255,000 | $76,971 | $178,029 |
| 2019 | $1,771 | $226,000 | $46,655 | $179,345 |
| 2018 | $1,648 | $197,000 | $46,655 | $150,345 |
| 2017 | $1,517 | $169,000 | $46,655 | $122,345 |
| 2016 | $1,529 | $92,096 | $22,549 | $69,547 |
| 2015 | $1,343 | $81,950 | $22,549 | $59,401 |
| 2014 | $1,279 | $76,612 | $23,090 | $53,522 |
Source: Public Records
Map
Nearby Homes