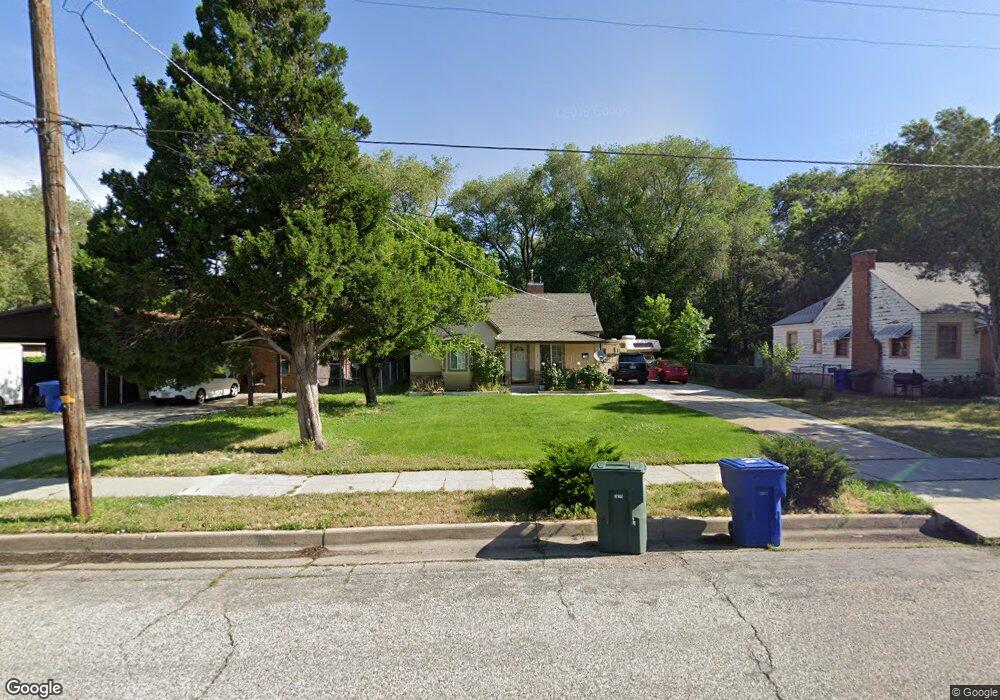
506 13th St Ogden, UT 84404
Canyon Road NeighborhoodEstimated Value: $322,000 - $367,000
3
Beds
1
Bath
1,483
Sq Ft
$228/Sq Ft
Est. Value
About This Home
This home is located at 506 13th St, Ogden, UT 84404 and is currently estimated at $338,575, approximately $228 per square foot. 506 13th St is a home located in Weber County with nearby schools including New Bridge School, Mound Fort Junior High School, and Ben Lomond High School.
Ownership History
Date
Name
Owned For
Owner Type
Purchase Details
Closed on
Oct 25, 2014
Sold by
Frias Adan and Frias Maria Y
Bought by
Frias Adan and Frias Yolanda Rosas
Current Estimated Value
Home Financials for this Owner
Home Financials are based on the most recent Mortgage that was taken out on this home.
Original Mortgage
$56,926
Outstanding Balance
$18,889
Interest Rate
3.87%
Mortgage Type
FHA
Estimated Equity
$319,686
Purchase Details
Closed on
Feb 26, 1998
Sold by
Lyons John A and Lyons Rhonda K
Bought by
Frias Adan and Frias Maria Y
Home Financials for this Owner
Home Financials are based on the most recent Mortgage that was taken out on this home.
Original Mortgage
$79,777
Interest Rate
6.9%
Mortgage Type
FHA
Purchase Details
Closed on
Jan 16, 1997
Sold by
Woolf Rhonda K and Lyons Rhonda K
Bought by
Lyons John A and Lyons Rhonda K
Create a Home Valuation Report for This Property
The Home Valuation Report is an in-depth analysis detailing your home's value as well as a comparison with similar homes in the area
Home Values in the Area
Average Home Value in this Area
Purchase History
| Date | Buyer | Sale Price | Title Company |
|---|---|---|---|
| Frias Adan | -- | Eagle Gate Title Ins Agency | |
| Frias Adan | -- | Bonneville Title Company | |
| Lyons John A | -- | -- |
Source: Public Records
Mortgage History
| Date | Status | Borrower | Loan Amount |
|---|---|---|---|
| Open | Frias Adan | $56,926 | |
| Closed | Frias Adan | $79,777 |
Source: Public Records
Tax History Compared to Growth
Tax History
| Year | Tax Paid | Tax Assessment Tax Assessment Total Assessment is a certain percentage of the fair market value that is determined by local assessors to be the total taxable value of land and additions on the property. | Land | Improvement |
|---|---|---|---|---|
| 2025 | $2,251 | $338,500 | $102,192 | $236,308 |
| 2024 | $2,251 | $178,198 | $56,220 | $121,978 |
| 2023 | $2,160 | $172,151 | $52,916 | $119,235 |
| 2022 | $2,293 | $183,151 | $47,471 | $135,680 |
| 2021 | $1,840 | $244,000 | $46,180 | $197,820 |
| 2020 | $1,608 | $197,001 | $35,977 | $161,024 |
| 2019 | $1,582 | $182,000 | $32,858 | $149,142 |
| 2018 | $1,339 | $153,001 | $32,858 | $120,143 |
| 2017 | $1,209 | $129,000 | $26,691 | $102,309 |
| 2016 | $1,010 | $58,269 | $14,766 | $43,503 |
| 2015 | $918 | $51,665 | $14,766 | $36,899 |
| 2014 | $917 | $50,702 | $11,951 | $38,751 |
Source: Public Records
Map
Nearby Homes
- 524 14th St
- 3564 S Jefferson Ave
- Cove Plan at Midtown Village
- Haven Plan at Midtown Village
- 1107 Jefferson Ave
- 387 14th St
- 987 S Jefferson Ave
- 1312 Grant Ave
- 358 E 11th St
- 968 S Jefferson Ave
- 1324 Liberty Ave
- 1137 Liberty Ave
- 1609 S Washington Blvd
- 454 Cross St
- 2683 S Jefferson Ave
- 965 Kiesel Ave
- 955 Kiesel Ave
- 1520 Madison Ave
- 1116 Liberty Ave
- 554 17th St