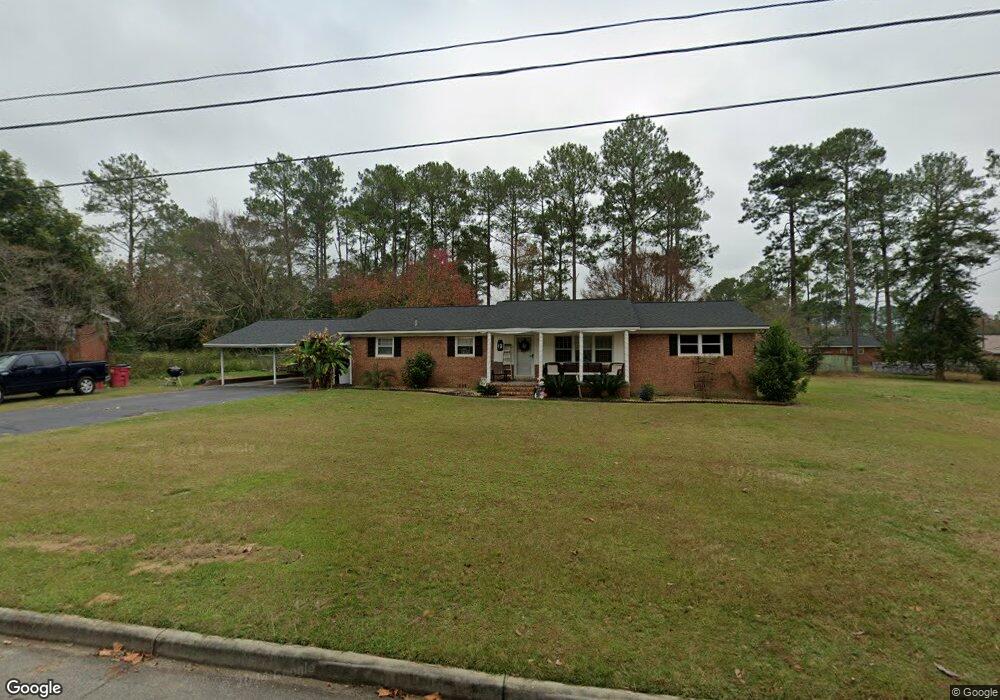
506 18th St E Tifton, GA 31794
Estimated Value: $201,739 - $231,000
3
Beds
2
Baths
1,827
Sq Ft
$120/Sq Ft
Est. Value
About This Home
This home is located at 506 18th St E, Tifton, GA 31794 and is currently estimated at $219,185, approximately $119 per square foot. 506 18th St E is a home located in Tift County with nearby schools including Northside Primary School, Charles Spencer Elementary School, and J.T. Reddick School.
Ownership History
Date
Name
Owned For
Owner Type
Purchase Details
Closed on
Dec 31, 2004
Sold by
Nesmith Eva
Bought by
Nesmith Billy
Current Estimated Value
Purchase Details
Closed on
Oct 17, 2001
Sold by
Nesmith Billy C
Bought by
Nesmith Eva
Purchase Details
Closed on
May 11, 1998
Sold by
Nesmith Eva
Bought by
Nesmith Billy C
Purchase Details
Closed on
May 25, 1988
Sold by
Nesmith Jack Estate
Bought by
Nesmith Eva
Create a Home Valuation Report for This Property
The Home Valuation Report is an in-depth analysis detailing your home's value as well as a comparison with similar homes in the area
Home Values in the Area
Average Home Value in this Area
Purchase History
| Date | Buyer | Sale Price | Title Company |
|---|---|---|---|
| Nesmith Billy | -- | -- | |
| Nesmith Billy | -- | -- | |
| Nesmith Eva | -- | -- | |
| Nesmith Billy C | -- | -- | |
| Nesmith Eva | -- | -- |
Source: Public Records
Tax History Compared to Growth
Tax History
| Year | Tax Paid | Tax Assessment Tax Assessment Total Assessment is a certain percentage of the fair market value that is determined by local assessors to be the total taxable value of land and additions on the property. | Land | Improvement |
|---|---|---|---|---|
| 2024 | $1,596 | $85,542 | $2,940 | $82,602 |
| 2023 | $2,084 | $45,263 | $4,400 | $40,863 |
| 2022 | $1,703 | $45,263 | $4,400 | $40,863 |
| 2021 | $1,714 | $45,263 | $4,400 | $40,863 |
| 2020 | $1,757 | $45,263 | $4,400 | $40,863 |
| 2019 | $1,758 | $45,263 | $4,400 | $40,863 |
| 2018 | $1,758 | $45,263 | $4,400 | $40,863 |
| 2017 | $1,804 | $45,263 | $4,400 | $40,863 |
| 2016 | $1,806 | $45,263 | $4,400 | $40,863 |
| 2015 | $1,809 | $45,263 | $4,400 | $40,863 |
| 2014 | $1,817 | $45,413 | $4,400 | $41,013 |
| 2013 | -- | $45,412 | $4,400 | $41,012 |
Source: Public Records
Map
Nearby Homes
- 502 20th St E
- 1809 Davis Ave
- 0 Tift Ave
- 705 20th St E
- 1611 Love Ave
- 2020 Davis Ave
- 2021 Davis Ave
- 0 Central Ave Unit 138182
- 0 Central Ave Unit 137897
- 0 Central Ave Unit 137896
- 0 Central Ave Unit 137898
- 0 Central Ave Unit 137895
- 2214 Love Ave
- 2411 Davis Ave
- 2417 Belmont Ave
- 1430 Madison Ave
- 1617 Wilson Ave N
- 15 acres Us Highway 41
- 33.7 ac Us Highway 41
- 48 acres Us Highway 41