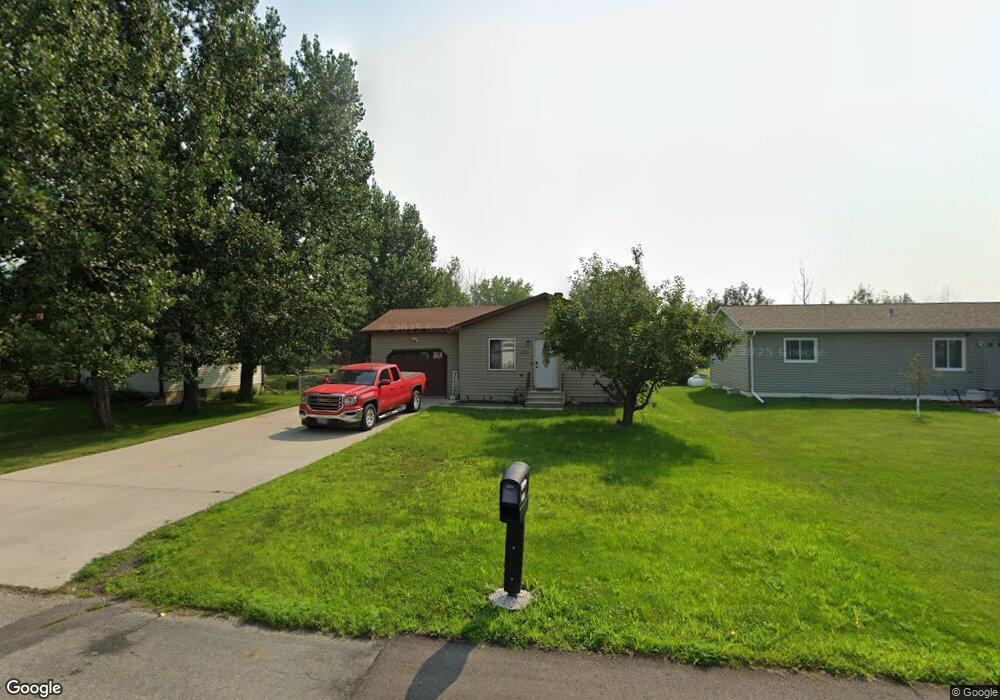
506 3rd St E Horace, ND 58047
Estimated Value: $219,000 - $293,000
3
Beds
1
Bath
2,016
Sq Ft
$123/Sq Ft
Est. Value
About This Home
This home is located at 506 3rd St E, Horace, ND 58047 and is currently estimated at $248,223, approximately $123 per square foot. 506 3rd St E is a home located in Cass County with nearby schools including Horace Elementary School, Liberty Middle School, and West Fargo Sheyenne High School.
Ownership History
Date
Name
Owned For
Owner Type
Purchase Details
Closed on
Oct 6, 2017
Sold by
Sorum Robyn and Sorum Bruce
Bought by
Niemi Brayden M and Blashak Ashlee G
Current Estimated Value
Home Financials for this Owner
Home Financials are based on the most recent Mortgage that was taken out on this home.
Original Mortgage
$161,515
Outstanding Balance
$133,604
Interest Rate
3.82%
Mortgage Type
New Conventional
Estimated Equity
$114,619
Create a Home Valuation Report for This Property
The Home Valuation Report is an in-depth analysis detailing your home's value as well as a comparison with similar homes in the area
Home Values in the Area
Average Home Value in this Area
Purchase History
| Date | Buyer | Sale Price | Title Company |
|---|---|---|---|
| Niemi Brayden M | $189,900 | Regency Title |
Source: Public Records
Mortgage History
| Date | Status | Borrower | Loan Amount |
|---|---|---|---|
| Open | Niemi Brayden M | $161,515 |
Source: Public Records
Tax History
| Year | Tax Paid | Tax Assessment Tax Assessment Total Assessment is a certain percentage of the fair market value that is determined by local assessors to be the total taxable value of land and additions on the property. | Land | Improvement |
|---|---|---|---|---|
| 2024 | $2,104 | $95,500 | $14,300 | $81,200 |
| 2023 | $2,596 | $95,500 | $14,300 | $81,200 |
| 2022 | $2,580 | $90,450 | $14,300 | $76,150 |
| 2021 | $2,479 | $85,350 | $14,300 | $71,050 |
| 2020 | $2,668 | $82,800 | $14,300 | $68,500 |
| 2019 | $2,355 | $71,900 | $14,750 | $57,150 |
| 2018 | $2,269 | $71,900 | $14,750 | $57,150 |
| 2017 | $2,136 | $69,150 | $14,200 | $54,950 |
| 2016 | $1,963 | $67,150 | $13,800 | $53,350 |
| 2015 | $1,938 | $62,200 | $12,800 | $49,400 |
| 2014 | $1,870 | $60,400 | $12,450 | $47,950 |
| 2013 | $1,767 | $54,900 | $11,300 | $43,600 |
Source: Public Records
Map
Nearby Homes
- 609 5th St E
- 405 5th St E
- 319 6th St E
- 218 5th St E
- 832 Harvest Cir
- 836 Harvest Cir
- 828 Harvest Cir
- 824 Harvest Cir
- 820 Harvest Cir
- 840 Harvest Cir
- 816 Harvest Cir
- 812 Harvest Cir
- 844 Harvest Cir
- 808 Harvest Cir
- 829 Harvest Cir
- 726 Prairie Ave
- 848 Harvest Cir
- 761 2nd Ave
- 821 Harvest Cir
- 851 Harvest Cir
Your Personal Tour Guide
Ask me questions while you tour the home.