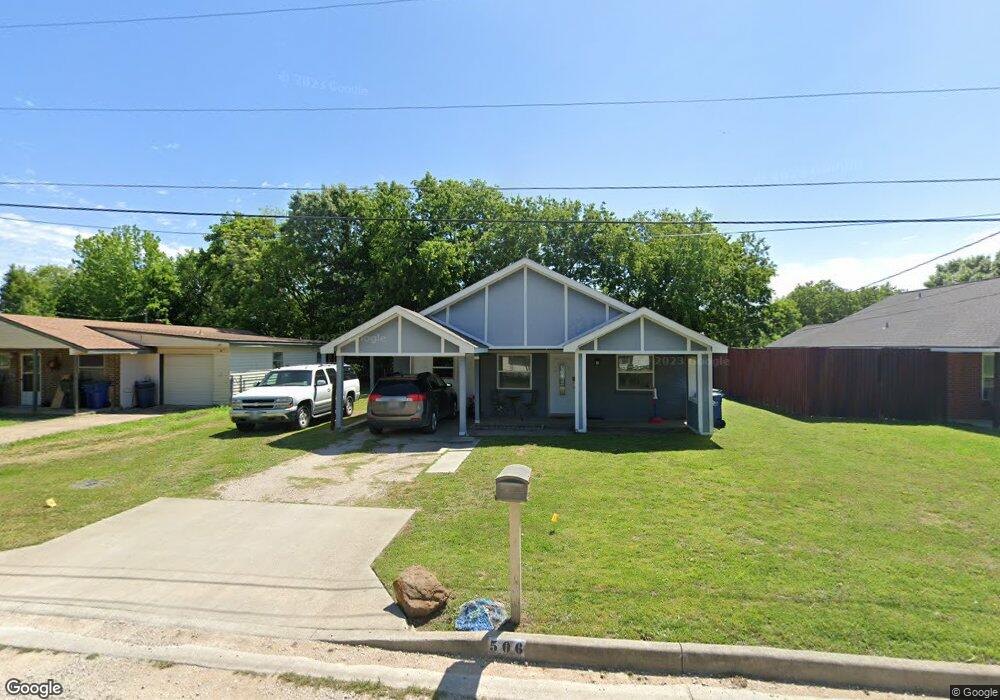
506 Denton St Sanger, TX 76266
Estimated Value: $195,431 - $240,000
3
Beds
1
Bath
1,198
Sq Ft
$187/Sq Ft
Est. Value
About This Home
This home is located at 506 Denton St, Sanger, TX 76266 and is currently estimated at $224,608, approximately $187 per square foot. 506 Denton St is a home located in Denton County with nearby schools including Chisholm Trail Elementary School, Clear Creek Intermediate School, and Sanger Sixth Grade Campus.
Ownership History
Date
Name
Owned For
Owner Type
Purchase Details
Closed on
Sep 8, 2011
Sold by
United States Of America
Bought by
Ibarra Marcos
Current Estimated Value
Purchase Details
Closed on
Sep 7, 2010
Sold by
Salcedo Esperanza D
Bought by
United States Of America
Purchase Details
Closed on
May 31, 2001
Sold by
Arledge Joe Scott and Arledge Kathy
Bought by
Salcedo Esperanza D
Home Financials for this Owner
Home Financials are based on the most recent Mortgage that was taken out on this home.
Original Mortgage
$65,100
Interest Rate
7.07%
Purchase Details
Closed on
Jul 20, 2000
Sold by
Arledge Wynema June Harper Schertz
Bought by
Arledge Joe Scott
Home Financials for this Owner
Home Financials are based on the most recent Mortgage that was taken out on this home.
Original Mortgage
$43,000
Interest Rate
8.36%
Mortgage Type
Seller Take Back
Purchase Details
Closed on
Aug 11, 1998
Sold by
Medley Doris Gayle Harper and Harper Donald Melton
Bought by
Schertz Wynema June Harper
Create a Home Valuation Report for This Property
The Home Valuation Report is an in-depth analysis detailing your home's value as well as a comparison with similar homes in the area
Home Values in the Area
Average Home Value in this Area
Purchase History
| Date | Buyer | Sale Price | Title Company |
|---|---|---|---|
| Ibarra Marcos | $35,000 | None Available | |
| United States Of America | $44,452 | None Available | |
| Salcedo Esperanza D | -- | -- | |
| Arledge Joe Scott | -- | -- | |
| Schertz Wynema June Harper | -- | -- |
Source: Public Records
Mortgage History
| Date | Status | Borrower | Loan Amount |
|---|---|---|---|
| Previous Owner | Salcedo Esperanza D | $65,100 | |
| Previous Owner | Arledge Joe Scott | $43,000 |
Source: Public Records
Tax History Compared to Growth
Tax History
| Year | Tax Paid | Tax Assessment Tax Assessment Total Assessment is a certain percentage of the fair market value that is determined by local assessors to be the total taxable value of land and additions on the property. | Land | Improvement |
|---|---|---|---|---|
| 2025 | $1,578 | $144,532 | $59,058 | $85,474 |
| 2024 | $2,731 | $135,125 | $0 | $0 |
| 2023 | $1,333 | $122,841 | $45,934 | $98,344 |
| 2022 | $2,477 | $111,674 | $36,091 | $105,304 |
| 2021 | $2,134 | $133,532 | $29,529 | $104,003 |
| 2020 | $2,042 | $92,293 | $29,529 | $81,794 |
| 2019 | $1,910 | $83,903 | $29,529 | $83,134 |
| 2018 | $1,746 | $76,275 | $29,529 | $63,841 |
| 2017 | $1,595 | $69,341 | $29,529 | $58,206 |
| 2016 | $1,450 | $63,037 | $16,405 | $46,632 |
| 2015 | $1,109 | $57,334 | $16,405 | $40,929 |
| 2013 | -- | $60,464 | $16,405 | $44,059 |
Source: Public Records
Map
Nearby Homes
- 710 W Willow St
- 505 Houston St
- 509 Marshall St
- 113 Diane Dr
- 109 Colonial Heights
- 319 Austin St
- 109 S 5th St
- 1010 Bolivar St
- 411 Hughes St
- 212 Diane Dr
- 1209 Bolivar St
- 226 Hillcrest St
- 702 Peach St Unit 2
- 612 N 10th St
- 106 W Holt St
- 902 Plum St
- 202 Southland Dr
- 209 Southland Dr
- 185 Aster Dr
- 124 Morning Glory