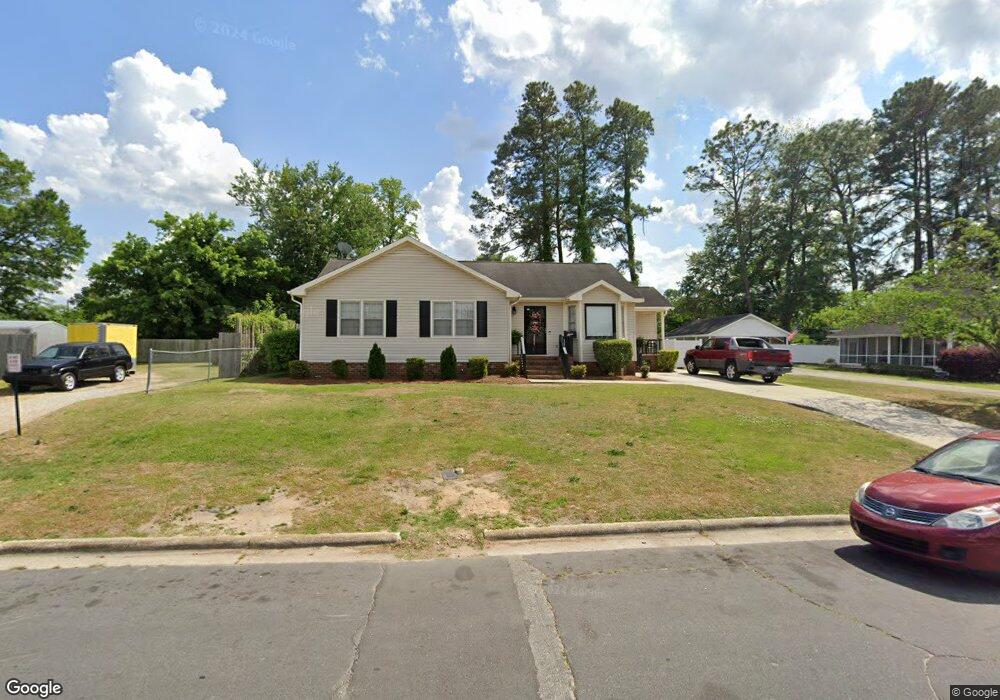
506 E 18th St Lumberton, NC 28358
Estimated Value: $141,000 - $161,000
3
Beds
2
Baths
1,444
Sq Ft
$104/Sq Ft
Est. Value
About This Home
This home is located at 506 E 18th St, Lumberton, NC 28358 and is currently estimated at $150,744, approximately $104 per square foot. 506 E 18th St is a home located in Robeson County with nearby schools including Rowland Norment Elementary School, Parkton Elementary School, and L. Gilbert Carroll Middle School.
Ownership History
Date
Name
Owned For
Owner Type
Purchase Details
Closed on
Oct 15, 2010
Sold by
Graves Michael Allen
Bought by
Page Zino Leon and Ewing Page April S
Current Estimated Value
Home Financials for this Owner
Home Financials are based on the most recent Mortgage that was taken out on this home.
Original Mortgage
$100,000
Outstanding Balance
$71,343
Interest Rate
4.36%
Mortgage Type
USDA
Estimated Equity
$79,401
Purchase Details
Closed on
Jun 9, 2005
Sold by
Graves Earl H and Graves Michael Allen
Bought by
Graves Michael Allen
Create a Home Valuation Report for This Property
The Home Valuation Report is an in-depth analysis detailing your home's value as well as a comparison with similar homes in the area
Purchase History
| Date | Buyer | Sale Price | Title Company |
|---|---|---|---|
| Page Zino Leon | $100,000 | -- | |
| Graves Michael Allen | -- | -- |
Source: Public Records
Mortgage History
| Date | Status | Borrower | Loan Amount |
|---|---|---|---|
| Open | Page Zino Leon | $100,000 |
Source: Public Records
Tax History
| Year | Tax Paid | Tax Assessment Tax Assessment Total Assessment is a certain percentage of the fair market value that is determined by local assessors to be the total taxable value of land and additions on the property. | Land | Improvement |
|---|---|---|---|---|
| 2025 | $973 | $119,000 | $11,000 | $108,000 |
| 2024 | $968 | $119,000 | $11,000 | $108,000 |
| 2023 | $801 | $95,000 | $10,000 | $85,000 |
| 2022 | $802 | $95,000 | $10,000 | $85,000 |
| 2021 | $803 | $95,000 | $10,000 | $85,000 |
| 2020 | $789 | $95,000 | $10,000 | $85,000 |
| 2018 | $792 | $94,100 | $10,000 | $84,100 |
| 2017 | $785 | $94,100 | $10,000 | $84,100 |
| 2016 | $785 | $94,100 | $10,000 | $84,100 |
| 2015 | $785 | $94,100 | $10,000 | $84,100 |
| 2014 | $785 | $94,100 | $10,000 | $84,100 |
Source: Public Records
Map
Nearby Homes
Your Personal Tour Guide
Ask me questions while you tour the home.