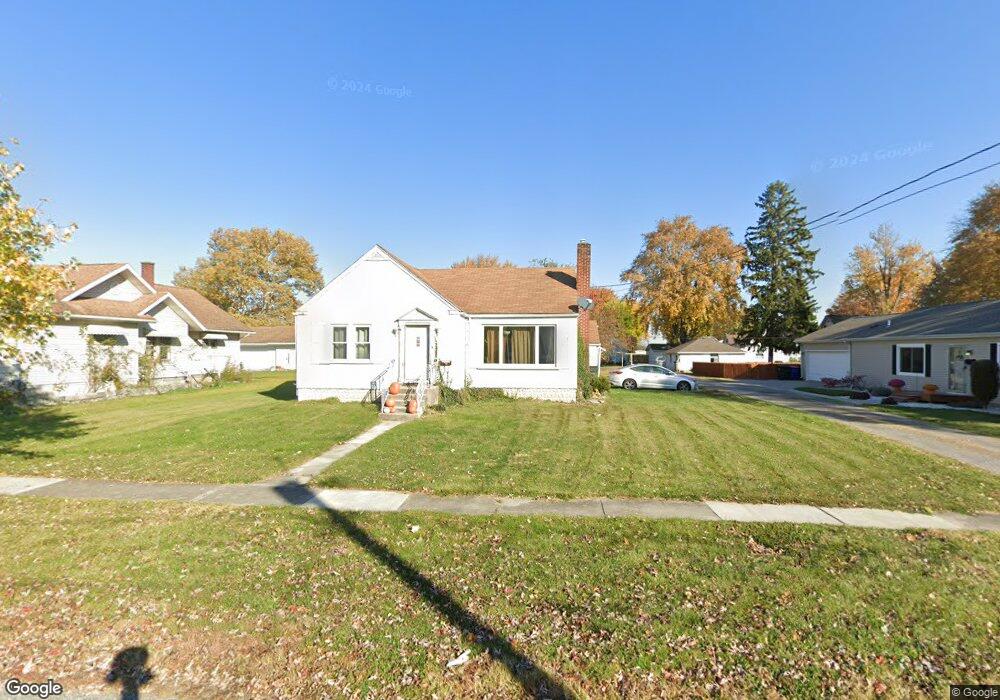
506 E 8th St Delphos, OH 45833
Estimated Value: $113,000 - $130,000
2
Beds
1
Bath
964
Sq Ft
$127/Sq Ft
Est. Value
About This Home
This home is located at 506 E 8th St, Delphos, OH 45833 and is currently estimated at $122,077, approximately $126 per square foot. 506 E 8th St is a home located in Allen County with nearby schools including Delphos St. John's High School and Delphos St. John's Elementary School.
Ownership History
Date
Name
Owned For
Owner Type
Purchase Details
Closed on
Mar 22, 2017
Sold by
Spring Dennis J
Bought by
Spring Melody A
Current Estimated Value
Purchase Details
Closed on
Feb 20, 2002
Sold by
Haunhorst Alan S
Bought by
Spring Dennis J and Spring Melody A
Home Financials for this Owner
Home Financials are based on the most recent Mortgage that was taken out on this home.
Original Mortgage
$63,000
Outstanding Balance
$32,697
Interest Rate
10.8%
Mortgage Type
New Conventional
Estimated Equity
$89,380
Purchase Details
Closed on
Oct 29, 1999
Sold by
Will Richard J
Bought by
Haunhorst Alan S and Haunhorst Beverly J
Home Financials for this Owner
Home Financials are based on the most recent Mortgage that was taken out on this home.
Original Mortgage
$32,350
Interest Rate
7.87%
Mortgage Type
New Conventional
Purchase Details
Closed on
Jan 1, 1990
Bought by
Will Elmer
Create a Home Valuation Report for This Property
The Home Valuation Report is an in-depth analysis detailing your home's value as well as a comparison with similar homes in the area
Home Values in the Area
Average Home Value in this Area
Purchase History
| Date | Buyer | Sale Price | Title Company |
|---|---|---|---|
| Spring Melody A | -- | None Available | |
| Spring Dennis J | $70,000 | -- | |
| Haunhorst Alan S | $40,000 | -- | |
| Will Elmer | -- | -- |
Source: Public Records
Mortgage History
| Date | Status | Borrower | Loan Amount |
|---|---|---|---|
| Open | Spring Dennis J | $63,000 | |
| Previous Owner | Haunhorst Alan S | $32,350 |
Source: Public Records
Tax History
| Year | Tax Paid | Tax Assessment Tax Assessment Total Assessment is a certain percentage of the fair market value that is determined by local assessors to be the total taxable value of land and additions on the property. | Land | Improvement |
|---|---|---|---|---|
| 2024 | $1,000 | $32,140 | $8,020 | $24,120 |
| 2023 | $791 | $23,980 | $5,990 | $17,990 |
| 2022 | $810 | $23,980 | $5,990 | $17,990 |
| 2021 | $816 | $23,980 | $5,990 | $17,990 |
| 2020 | $684 | $21,250 | $5,710 | $15,540 |
| 2019 | $684 | $21,250 | $5,710 | $15,540 |
| 2018 | $682 | $21,250 | $5,710 | $15,540 |
| 2017 | $650 | $19,850 | $5,710 | $14,140 |
| 2016 | $664 | $19,850 | $5,710 | $14,140 |
| 2015 | $654 | $19,850 | $5,710 | $14,140 |
| 2014 | $649 | $19,640 | $5,460 | $14,180 |
| 2013 | $654 | $19,640 | $5,460 | $14,180 |
Source: Public Records
Map
Nearby Homes
- 628 N Pierce St
- 610 N Washington St
- 702 N Main St
- 201 E 5th St
- 404 E 3rd St
- 821 E 3rd St
- 221 S Main St
- 537 / 539 Toomey
- 415 Maple St
- 709 W 4th St
- 424 S Canal St
- 1000 Colettas Way
- 483 S Franklin St
- 827 S Washington St
- 6800 N Defiance Trail
- 8448 Elida Rd
- 180 3rd St
- 608 N Adams St
- 9750 Middle Point Rd
- 3755 Grubb Rd N
Your Personal Tour Guide
Ask me questions while you tour the home.