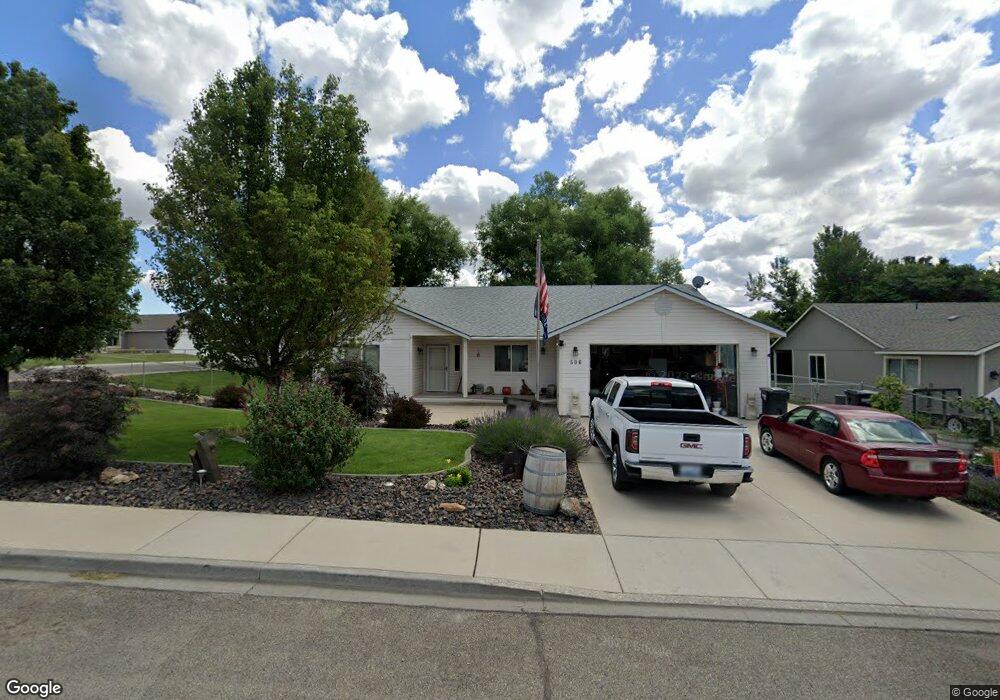
506 Grader Ct Benton City, WA 99320
Estimated Value: $407,421 - $469,000
4
Beds
2
Baths
1,675
Sq Ft
$266/Sq Ft
Est. Value
About This Home
This home is located at 506 Grader Ct, Benton City, WA 99320 and is currently estimated at $445,855, approximately $266 per square foot. 506 Grader Ct is a home located in Benton County with nearby schools including Kiona-Benton City Primary School, Kiona-Benton City Middle School, and Kiona-Benton City High School.
Ownership History
Date
Name
Owned For
Owner Type
Purchase Details
Closed on
Oct 8, 2020
Sold by
Schatz Adam J
Bought by
Schatz Julie A
Current Estimated Value
Home Financials for this Owner
Home Financials are based on the most recent Mortgage that was taken out on this home.
Original Mortgage
$81,000
Outstanding Balance
$43,999
Interest Rate
2.8%
Mortgage Type
New Conventional
Estimated Equity
$401,856
Purchase Details
Closed on
Dec 23, 2016
Sold by
Schatz Adam J
Bought by
Schatz Adam J and Schatz Julie
Purchase Details
Closed on
Jun 8, 2005
Sold by
Conner Construction
Bought by
Schatz Adam J
Home Financials for this Owner
Home Financials are based on the most recent Mortgage that was taken out on this home.
Original Mortgage
$108,900
Interest Rate
5.72%
Mortgage Type
New Conventional
Create a Home Valuation Report for This Property
The Home Valuation Report is an in-depth analysis detailing your home's value as well as a comparison with similar homes in the area
Home Values in the Area
Average Home Value in this Area
Purchase History
| Date | Buyer | Sale Price | Title Company |
|---|---|---|---|
| Schatz Julie A | -- | Chicago Title Company | |
| Schatz Adam J | -- | None Available | |
| Schatz Adam J | $153,678 | Benton Franklin Titl |
Source: Public Records
Mortgage History
| Date | Status | Borrower | Loan Amount |
|---|---|---|---|
| Open | Schatz Julie A | $81,000 | |
| Closed | Schatz Adam J | $108,900 |
Source: Public Records
Tax History Compared to Growth
Tax History
| Year | Tax Paid | Tax Assessment Tax Assessment Total Assessment is a certain percentage of the fair market value that is determined by local assessors to be the total taxable value of land and additions on the property. | Land | Improvement |
|---|---|---|---|---|
| 2024 | $2,671 | $373,340 | $90,000 | $283,340 |
| 2023 | $2,946 | $322,080 | $50,000 | $272,080 |
| 2022 | $2,975 | $273,250 | $50,000 | $223,250 |
| 2021 | $2,053 | $252,320 | $50,000 | $202,320 |
| 2020 | $2,736 | $217,440 | $50,000 | $167,440 |
| 2019 | $2,425 | $210,460 | $50,000 | $160,460 |
| 2018 | $2,496 | $189,530 | $50,000 | $139,530 |
| 2017 | $2,043 | $155,960 | $36,000 | $119,960 |
| 2016 | $2,452 | $155,960 | $36,000 | $119,960 |
| 2015 | $2,181 | $155,960 | $36,000 | $119,960 |
| 2014 | -- | $155,960 | $36,000 | $119,960 |
| 2013 | -- | $155,960 | $36,000 | $119,960 |
Source: Public Records
Map
Nearby Homes
- 503 Grader Ct
- 1712 Kendall Rd NW
- 501 Dozer Ct
- NKA Kendall Rd
- 1303 Babs Ave
- 901 W 13th St
- 39304 N Olson Prairie NW
- 805 Babs Ave
- 610 Botaka Loop
- 9414 W Yakitat Place
- 2202 Rainy Ln
- 10711 W Yakitat Place
- 1417 Jenna Ave
- 1415 Jenna Ave
- 1405 Jenna Ave
- 0 Lot 3 Block 7 Legion Heights #2 Unit 284583
- 1201 17th St
- 1109 18th St
- Whidbey Plan at Cherry Grove Lane
- Grandview Plan at Cherry Grove Lane
- 1581 Kendall Rd
- 504 Grader Ct
- 507 Loader Ct
- 507 Grader Ct
- 505 Grader Ct
- 505 Loader Ct
- 1606 Kendall Rd NW
- 502 Grader Ct
- 1610 Kendall Rd NW
- 503 Loader Ct
- 500 Grader Ct
- 500 Grader Ct
- 504 Paver Ct
- 501 Grader Ct
- 1614 Kendall Rd NW
- 506 Paver Ct
- 502 Paver Ct
- 1507 Willow Way
- 1519 Willow Way
- 506 Loader Ct Unit GREAT NEW PRICE - SH