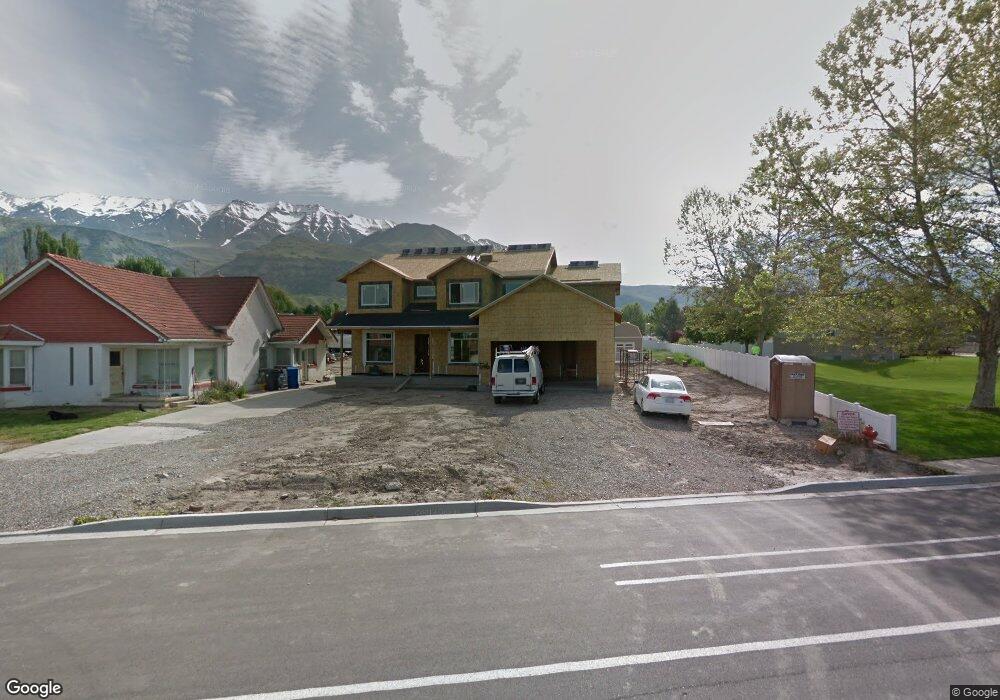
506 N Locust Ave Lindon, UT 84042
Estimated Value: $818,000 - $1,138,000
4
Beds
4
Baths
3,212
Sq Ft
$318/Sq Ft
Est. Value
About This Home
This home is located at 506 N Locust Ave, Lindon, UT 84042 and is currently estimated at $1,022,778, approximately $318 per square foot. 506 N Locust Ave is a home with nearby schools including Lindon Elementary School, Oak Canyon Junior High School, and Pleasant Grove High School.
Ownership History
Date
Name
Owned For
Owner Type
Purchase Details
Closed on
Nov 8, 2021
Sold by
Chris Burnard
Bought by
Johnson Blake J and Johnson Megan
Current Estimated Value
Purchase Details
Closed on
Mar 24, 2021
Sold by
Sumsion Scott J and Sumsion Linda C
Bought by
Burnard Chris and Burnard Heidi
Home Financials for this Owner
Home Financials are based on the most recent Mortgage that was taken out on this home.
Original Mortgage
$530,000
Interest Rate
2.73%
Mortgage Type
New Conventional
Purchase Details
Closed on
Oct 26, 2015
Sold by
Torgersen Danielle K
Bought by
Atkinson Jeff Davies
Home Financials for this Owner
Home Financials are based on the most recent Mortgage that was taken out on this home.
Original Mortgage
$420,000
Interest Rate
3.85%
Mortgage Type
Construction
Create a Home Valuation Report for This Property
The Home Valuation Report is an in-depth analysis detailing your home's value as well as a comparison with similar homes in the area
Home Values in the Area
Average Home Value in this Area
Purchase History
| Date | Buyer | Sale Price | Title Company |
|---|---|---|---|
| Johnson Blake J | -- | Pro Title & Escrow | |
| Burnard Chris | -- | Provo Abstract Co | |
| Atkinson Jeff Davies | -- | Affiliated First Title Co |
Source: Public Records
Mortgage History
| Date | Status | Borrower | Loan Amount |
|---|---|---|---|
| Previous Owner | Burnard Chris | $530,000 | |
| Previous Owner | Atkinson Jeff Davies | $420,000 |
Source: Public Records
Tax History Compared to Growth
Tax History
| Year | Tax Paid | Tax Assessment Tax Assessment Total Assessment is a certain percentage of the fair market value that is determined by local assessors to be the total taxable value of land and additions on the property. | Land | Improvement |
|---|---|---|---|---|
| 2025 | $4,235 | $523,160 | $463,000 | $488,200 |
| 2024 | $4,235 | $522,005 | $0 | $0 |
| 2023 | $4,015 | $531,685 | $0 | $0 |
| 2022 | $3,983 | $509,520 | $0 | $0 |
| 2021 | $3,462 | $667,800 | $293,900 | $373,900 |
| 2020 | $3,301 | $626,700 | $267,200 | $359,500 |
| 2019 | $2,745 | $543,800 | $218,200 | $325,600 |
| 2018 | $2,541 | $474,600 | $191,500 | $283,100 |
| 2017 | $2,028 | $203,060 | $0 | $0 |
| 2016 | $1,154 | $106,900 | $0 | $0 |
Source: Public Records
Map
Nearby Homes