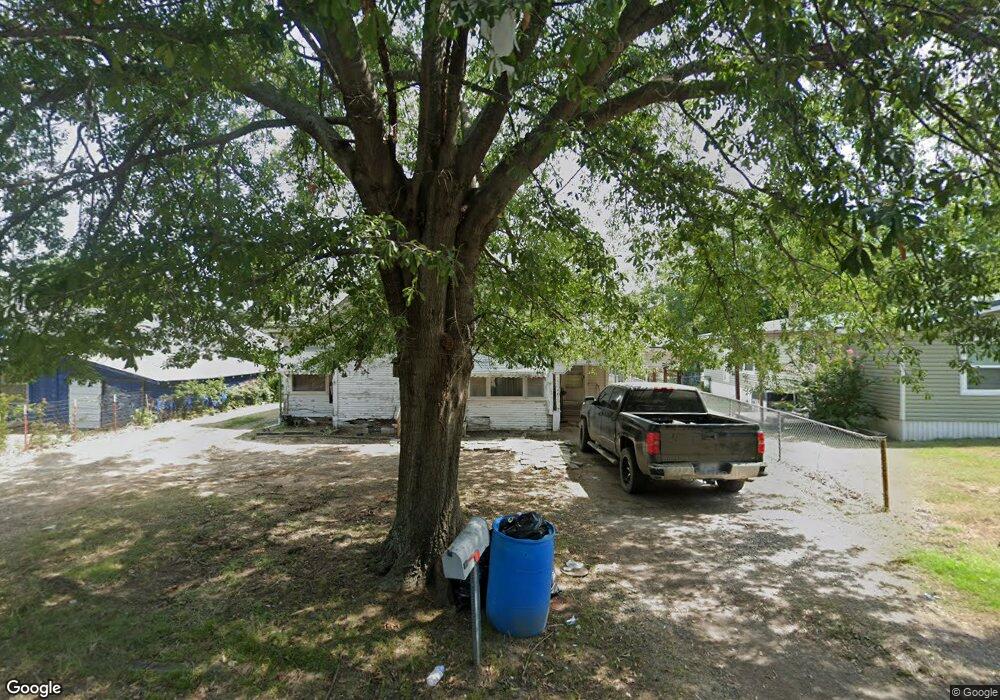
506 NE 2nd St Stigler, OK 74462
Estimated Value: $60,855 - $167,000
3
Beds
1
Bath
1,740
Sq Ft
$57/Sq Ft
Est. Value
About This Home
This home is located at 506 NE 2nd St, Stigler, OK 74462 and is currently estimated at $99,964, approximately $57 per square foot. 506 NE 2nd St is a home located in Haskell County with nearby schools including Stigler Elementary School, Stigler Middle School, and Stigler High School.
Ownership History
Date
Name
Owned For
Owner Type
Purchase Details
Closed on
Jun 19, 2023
Sold by
T+ H Inucstment Properties Llc
Bought by
Hernandez Bernabe
Current Estimated Value
Purchase Details
Closed on
Dec 11, 2013
Sold by
Wagner David
Bought by
T&H Investments Prop Llc
Purchase Details
Closed on
Oct 18, 2013
Sold by
Neal Jerome and Neal Nancy
Bought by
Wagner David
Purchase Details
Closed on
Mar 28, 2003
Sold by
Buford and Virginia Hope
Bought by
Jerome and Nancy Neal
Purchase Details
Closed on
Nov 20, 2002
Sold by
Euleta and Dennis Elam
Bought by
Buford and Virginia Hope
Create a Home Valuation Report for This Property
The Home Valuation Report is an in-depth analysis detailing your home's value as well as a comparison with similar homes in the area
Home Values in the Area
Average Home Value in this Area
Purchase History
| Date | Buyer | Sale Price | Title Company |
|---|---|---|---|
| Hernandez Bernabe | $15,000 | None Listed On Document | |
| T&H Investments Prop Llc | $24,000 | -- | |
| Wagner David | -- | -- | |
| Jerome | $20,000 | -- | |
| Buford | -- | -- |
Source: Public Records
Tax History Compared to Growth
Tax History
| Year | Tax Paid | Tax Assessment Tax Assessment Total Assessment is a certain percentage of the fair market value that is determined by local assessors to be the total taxable value of land and additions on the property. | Land | Improvement |
|---|---|---|---|---|
| 2025 | $365 | $4,686 | $633 | $4,053 |
| 2024 | $365 | $4,744 | $633 | $4,111 |
| 2023 | $215 | $2,793 | $495 | $2,298 |
| 2022 | $205 | $2,601 | $495 | $2,106 |
| 2021 | $200 | $2,601 | $495 | $2,106 |
| 2020 | $259 | $3,369 | $330 | $3,039 |
| 2019 | $249 | $3,209 | $330 | $2,879 |
| 2018 | $238 | $3,056 | $330 | $2,726 |
| 2017 | $227 | $2,911 | $330 | $2,581 |
| 2016 | $215 | $2,772 | $330 | $2,442 |
| 2015 | $205 | $2,640 | $330 | $2,310 |
| 2014 | $206 | $2,640 | $330 | $2,310 |
Source: Public Records
Map
Nearby Homes