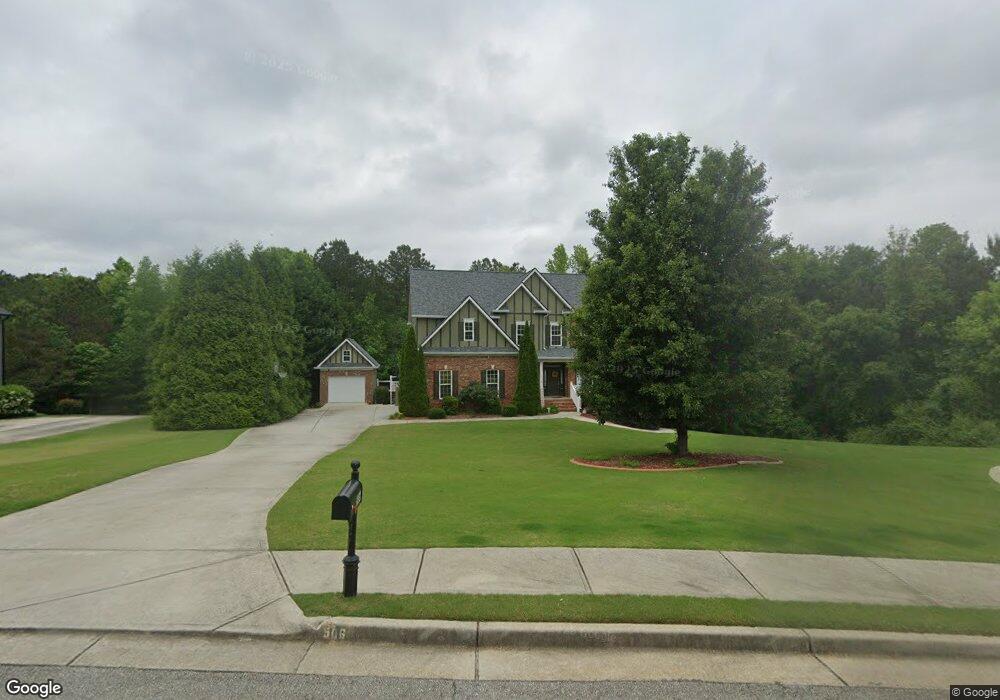
506 Persimmon Dr Sharpsburg, GA 30277
Estimated Value: $643,000 - $712,000
4
Beds
4
Baths
2,734
Sq Ft
$246/Sq Ft
Est. Value
About This Home
This home is located at 506 Persimmon Dr, Sharpsburg, GA 30277 and is currently estimated at $673,091, approximately $246 per square foot. 506 Persimmon Dr is a home located in Coweta County with nearby schools including Canongate Elementary School, Madras Middle School, and Northgate High School.
Ownership History
Date
Name
Owned For
Owner Type
Purchase Details
Closed on
Mar 15, 2017
Sold by
Vick Gregory M
Bought by
Navin Ann D
Current Estimated Value
Purchase Details
Closed on
May 3, 2011
Sold by
Jennings Jack and Jennings Jennifer
Bought by
Vick Gregory M
Home Financials for this Owner
Home Financials are based on the most recent Mortgage that was taken out on this home.
Original Mortgage
$292,395
Interest Rate
4.81%
Mortgage Type
FHA
Purchase Details
Closed on
Nov 9, 2005
Sold by
Olde Town Builders Inc
Bought by
Jennings Jack and Jennings Jennifer
Home Financials for this Owner
Home Financials are based on the most recent Mortgage that was taken out on this home.
Original Mortgage
$193,806
Interest Rate
6%
Mortgage Type
New Conventional
Purchase Details
Closed on
Sep 24, 2004
Sold by
D Brentt Llc
Bought by
Olde Towne Builders Inc
Purchase Details
Closed on
Sep 25, 2003
Sold by
Killearn Inc
Bought by
D Brentt Llc
Create a Home Valuation Report for This Property
The Home Valuation Report is an in-depth analysis detailing your home's value as well as a comparison with similar homes in the area
Home Values in the Area
Average Home Value in this Area
Purchase History
| Date | Buyer | Sale Price | Title Company |
|---|---|---|---|
| Navin Ann D | $377,000 | -- | |
| Vick Gregory M | $300,000 | -- | |
| Jennings Jack | $293,900 | -- | |
| Olde Towne Builders Inc | $1,250,000 | -- | |
| D Brentt Llc | $5,000,000 | -- |
Source: Public Records
Mortgage History
| Date | Status | Borrower | Loan Amount |
|---|---|---|---|
| Previous Owner | Vick Gregory M | $292,395 | |
| Previous Owner | Jennings Jack | $193,806 |
Source: Public Records
Tax History Compared to Growth
Tax History
| Year | Tax Paid | Tax Assessment Tax Assessment Total Assessment is a certain percentage of the fair market value that is determined by local assessors to be the total taxable value of land and additions on the property. | Land | Improvement |
|---|---|---|---|---|
| 2025 | $3,815 | $239,902 | $36,000 | $203,902 |
| 2024 | $3,601 | $234,727 | $36,000 | $198,727 |
| 2023 | $3,601 | $221,761 | $32,000 | $189,761 |
| 2022 | $2,935 | $197,250 | $32,000 | $165,250 |
| 2021 | $2,193 | $161,532 | $24,000 | $137,532 |
| 2020 | $2,720 | $161,532 | $24,000 | $137,532 |
| 2019 | $3,598 | $164,562 | $24,000 | $140,562 |
| 2018 | $3,157 | $149,231 | $24,000 | $125,231 |
| 2017 | $4,216 | $143,825 | $24,000 | $119,825 |
| 2016 | $3,904 | $134,816 | $24,000 | $110,816 |
| 2015 | $3,659 | $128,509 | $24,000 | $104,509 |
| 2014 | $3,083 | $109,155 | $24,000 | $85,155 |
Source: Public Records
Map
Nearby Homes
- 40 Joe Lee Dr
- 30 Joe Lee Dr
- 35 Palmer Place
- 291 Cannongate Rd
- 78 Rosebay Ln
- 32 Riverbirch Way
- 9 Warrior Way
- 518 Palmetto Tyrone Rd
- 56 Hudgen Rd
- 140 Palmetto Pines Rd
- 0 Fischer Spur Rd Unit 10495301
- 20 Skipton Ct
- 575 Laurelwood Dr
- 500 Laurelwood Dr
- 200 Chaparral Trace
- 110 Kylemore Pass
- 70 N Strathmore Dr
- 91 Goodlin Rd
- 27 Dorian Ct
- 150 Kylemore Pass
- 500 Persimmon Dr
- 514 Persimmon Dr Unit 58
- 514 Persimmon Dr
- 523 Persimmon Dr
- 523 Persimmon Dr Unit 68
- 480 Persimmon Dr
- 518 Persimmon Dr
- 528 Persimmon Dr
- 487 Persimmon Dr
- 534 Persimmon Dr
- 474 Persimmon Dr
- 467 Persimmon Dr
- 548 Persimmon Dr
- 551 Persimmon Dr
- 460 Persimmon Dr
- 255 Lawn Market
- 439 Persimmon Dr
- 560 Persimmon Dr
- 245 Lawn Market
- 561 Persimmon Dr