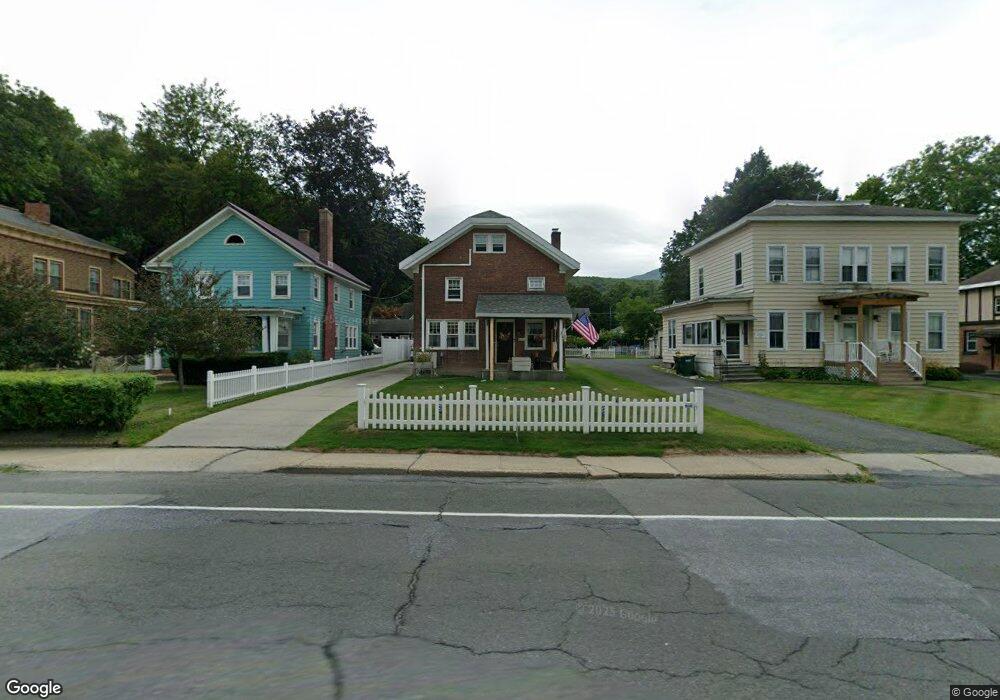
506 W Main St North Adams, MA 01247
Estimated Value: $219,000 - $266,000
3
Beds
2
Baths
1,435
Sq Ft
$174/Sq Ft
Est. Value
About This Home
This home is located at 506 W Main St, North Adams, MA 01247 and is currently estimated at $250,227, approximately $174 per square foot. 506 W Main St is a home located in Berkshire County with nearby schools including Greylock Elementary School and Drury High School.
Ownership History
Date
Name
Owned For
Owner Type
Purchase Details
Closed on
Apr 27, 2021
Sold by
Kennedy David R and Kennedy Mary B
Bought by
Cariddi Nathan and Cariddi David
Current Estimated Value
Purchase Details
Closed on
May 10, 1990
Sold by
Less Shirley
Bought by
Cariddi Mary Beth
Home Financials for this Owner
Home Financials are based on the most recent Mortgage that was taken out on this home.
Original Mortgage
$88,670
Interest Rate
10.15%
Mortgage Type
Purchase Money Mortgage
Create a Home Valuation Report for This Property
The Home Valuation Report is an in-depth analysis detailing your home's value as well as a comparison with similar homes in the area
Home Values in the Area
Average Home Value in this Area
Purchase History
| Date | Buyer | Sale Price | Title Company |
|---|---|---|---|
| Cariddi Nathan | -- | None Available | |
| Cariddi Nathan | -- | None Available | |
| Cariddi Mary Beth | $75,000 | -- | |
| Cariddi Mary Beth | $75,000 | -- |
Source: Public Records
Mortgage History
| Date | Status | Borrower | Loan Amount |
|---|---|---|---|
| Previous Owner | Cariddi Mary Beth | $68,000 | |
| Previous Owner | Cariddi Mary Beth | $88,670 |
Source: Public Records
Tax History Compared to Growth
Tax History
| Year | Tax Paid | Tax Assessment Tax Assessment Total Assessment is a certain percentage of the fair market value that is determined by local assessors to be the total taxable value of land and additions on the property. | Land | Improvement |
|---|---|---|---|---|
| 2025 | $4,007 | $239,800 | $22,800 | $217,000 |
| 2024 | $3,766 | $219,700 | $20,900 | $198,800 |
| 2023 | $3,636 | $205,800 | $20,900 | $184,900 |
| 2022 | $3,243 | $175,000 | $20,900 | $154,100 |
| 2021 | $3,015 | $162,000 | $19,300 | $142,700 |
| 2020 | $3,011 | $161,700 | $20,500 | $141,200 |
| 2019 | $2,966 | $155,200 | $20,500 | $134,700 |
| 2018 | $2,734 | $153,800 | $21,500 | $132,300 |
| 2017 | $2,691 | $152,300 | $21,300 | $131,000 |
| 2016 | $2,607 | $149,900 | $21,300 | $128,600 |
| 2015 | $2,520 | $151,000 | $22,000 | $129,000 |
Source: Public Records
Map
Nearby Homes