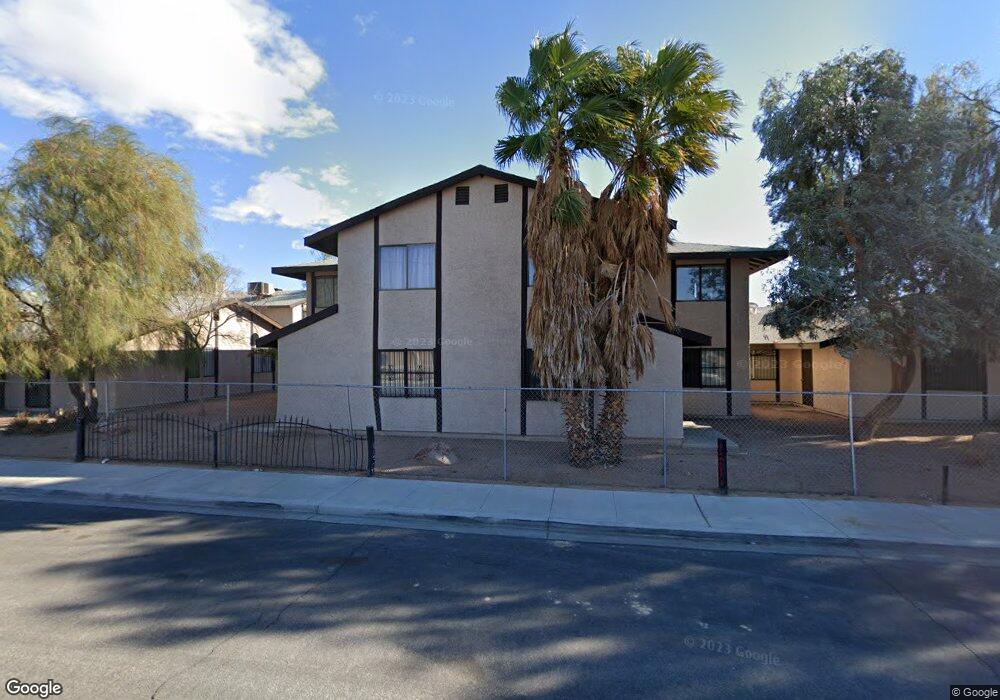
506 Wardelle St Unit D Las Vegas, NV 89101
East Las Vegas NeighborhoodEstimated Value: $117,000 - $155,196
2
Beds
1
Bath
1,002
Sq Ft
$142/Sq Ft
Est. Value
About This Home
This home is located at 506 Wardelle St Unit D, Las Vegas, NV 89101 and is currently estimated at $142,549, approximately $142 per square foot. 506 Wardelle St Unit D is a home located in Clark County with nearby schools including Arturo Cambeiro Elementary School, J.D. Smith Middle School, and Desert Pines High School.
Ownership History
Date
Name
Owned For
Owner Type
Purchase Details
Closed on
Feb 6, 2012
Sold by
Luevano Aguirre Laura
Bought by
Soukup Holdings Llc
Current Estimated Value
Purchase Details
Closed on
Mar 4, 2007
Sold by
Mantsch Edward W
Bought by
Luevano Aguirre Laura
Home Financials for this Owner
Home Financials are based on the most recent Mortgage that was taken out on this home.
Original Mortgage
$87,624
Interest Rate
6.1%
Mortgage Type
FHA
Purchase Details
Closed on
Feb 6, 2007
Sold by
Adal William
Bought by
Luevano Aguirre Laura
Home Financials for this Owner
Home Financials are based on the most recent Mortgage that was taken out on this home.
Original Mortgage
$87,624
Interest Rate
6.1%
Mortgage Type
FHA
Purchase Details
Closed on
Mar 2, 1999
Sold by
Mantsch William and Mantsch Edward W
Bought by
Mantsch Edward W
Home Financials for this Owner
Home Financials are based on the most recent Mortgage that was taken out on this home.
Original Mortgage
$20,625
Interest Rate
6.76%
Mortgage Type
FHA
Create a Home Valuation Report for This Property
The Home Valuation Report is an in-depth analysis detailing your home's value as well as a comparison with similar homes in the area
Home Values in the Area
Average Home Value in this Area
Purchase History
| Date | Buyer | Sale Price | Title Company |
|---|---|---|---|
| Soukup Holdings Llc | $23,000 | Chicago Title Las Vegas | |
| Luevano Aguirre Laura | $89,000 | Chicago Title | |
| Luevano Aguirre Laura | -- | Chicago Title Las Vegas | |
| Mantsch Edward W | -- | United Title |
Source: Public Records
Mortgage History
| Date | Status | Borrower | Loan Amount |
|---|---|---|---|
| Previous Owner | Luevano Aguirre Laura | $87,624 | |
| Previous Owner | Mantsch Edward W | $20,625 |
Source: Public Records
Tax History Compared to Growth
Tax History
| Year | Tax Paid | Tax Assessment Tax Assessment Total Assessment is a certain percentage of the fair market value that is determined by local assessors to be the total taxable value of land and additions on the property. | Land | Improvement |
|---|---|---|---|---|
| 2025 | $321 | $24,550 | $9,100 | $15,450 |
| 2024 | $312 | $24,550 | $9,100 | $15,450 |
| 2023 | $327 | $25,870 | $11,200 | $14,670 |
| 2022 | $317 | $23,895 | $10,150 | $13,745 |
| 2021 | $294 | $21,632 | $8,050 | $13,582 |
| 2020 | $293 | $19,884 | $6,125 | $13,759 |
| 2019 | $279 | $19,099 | $5,250 | $13,849 |
| 2018 | $266 | $15,699 | $3,850 | $11,849 |
| 2017 | $482 | $14,688 | $3,500 | $11,188 |
| 2016 | $254 | $10,195 | $2,625 | $7,570 |
| 2015 | $252 | $7,765 | $2,100 | $5,665 |
| 2014 | $244 | $7,312 | $1,750 | $5,562 |
Source: Public Records
Map
Nearby Homes
- 506 Wardelle St Unit C
- 2915 Cedar Ave Unit 11C
- 520 N 28th St
- 2645 Cedar Ave
- 2812 Marlin Ave
- 2516 E Mesquite Ave
- 2513 Cedar Ave
- 2600 E Bonanza Rd
- 0 Mcknight St
- 920 E Bonanza Rd
- 2218 E Mesquite Ave
- 802 Stewart Ave
- 921 Delta St
- 2408 Berkley Ave
- 2528 Sunrise Ave
- 2016 Linden Ave
- 50 N 27th St
- 2020 E Bonanza Rd
- 2317 Kirk Ave Unit 4
- 709 N 22nd St
- 506 Wardelle St Unit 202
- 506 Wardelle St Unit B
- 506 Wardelle St Unit A
- 504 Wardelle St Unit B
- 504 Wardelle St Unit A
- 500 Wardelle St Unit 102
- 502 Wardelle St Unit B
- 502 Wardelle St Unit D
- 502 Wardelle St Unit C
- 502 Wardelle St Unit A
- 2901 Cedar Ave Unit 101A
- 509 Wardelle St
- 513 Wardelle St
- 505 Wardelle St
- 517 Wardelle St
- 501 Wardelle St
- 2915 Cedar Ave Unit 3B
- 2915 Cedar Ave Unit 3A
- 2915 Cedar Ave Unit 7B
- 2915 Cedar Ave Unit 4A