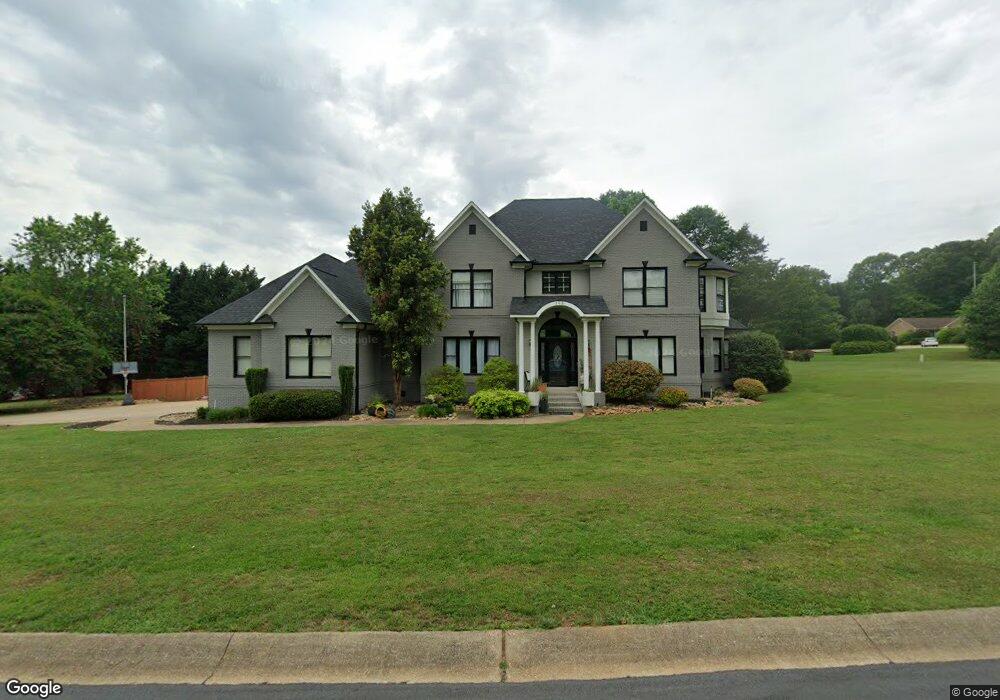
506 Wentworth Farm Cir Boiling Springs, SC 29316
Estimated Value: $657,659 - $728,000
4
Beds
4
Baths
3,986
Sq Ft
$175/Sq Ft
Est. Value
About This Home
This home is located at 506 Wentworth Farm Cir, Boiling Springs, SC 29316 and is currently estimated at $697,165, approximately $174 per square foot. 506 Wentworth Farm Cir is a home located in Spartanburg County with nearby schools including Boiling Springs Middle School and Boiling Springs High School.
Ownership History
Date
Name
Owned For
Owner Type
Purchase Details
Closed on
Jan 6, 2020
Sold by
Greene Ivy R and Turner Ivy Greene
Bought by
Parrish Sandra S
Current Estimated Value
Purchase Details
Closed on
Dec 27, 2013
Sold by
Hovis Scott M and Hovis Amanda S
Bought by
Parrish Sandra S and Greene Ivy R
Home Financials for this Owner
Home Financials are based on the most recent Mortgage that was taken out on this home.
Original Mortgage
$293,600
Interest Rate
4.29%
Mortgage Type
New Conventional
Purchase Details
Closed on
Oct 5, 2009
Sold by
Mason Darren and Mason Jada
Bought by
Hovis Scott M and Hovis Amanda S
Home Financials for this Owner
Home Financials are based on the most recent Mortgage that was taken out on this home.
Original Mortgage
$285,000
Interest Rate
5.05%
Mortgage Type
New Conventional
Create a Home Valuation Report for This Property
The Home Valuation Report is an in-depth analysis detailing your home's value as well as a comparison with similar homes in the area
Home Values in the Area
Average Home Value in this Area
Purchase History
| Date | Buyer | Sale Price | Title Company |
|---|---|---|---|
| Parrish Sandra S | -- | None Available | |
| Parrish Sandra S | $367,000 | -- | |
| Hovis Scott M | $300,001 | -- |
Source: Public Records
Mortgage History
| Date | Status | Borrower | Loan Amount |
|---|---|---|---|
| Previous Owner | Parrish Sandra S | $293,600 | |
| Previous Owner | Hovis Scott M | $285,000 |
Source: Public Records
Tax History Compared to Growth
Tax History
| Year | Tax Paid | Tax Assessment Tax Assessment Total Assessment is a certain percentage of the fair market value that is determined by local assessors to be the total taxable value of land and additions on the property. | Land | Improvement |
|---|---|---|---|---|
| 2025 | $10,695 | $30,140 | $4,009 | $26,131 |
| 2024 | $10,695 | $30,140 | $4,009 | $26,131 |
| 2023 | $10,695 | $30,140 | $4,009 | $26,131 |
| 2022 | $9,712 | $26,208 | $2,700 | $23,508 |
| 2021 | $9,704 | $26,208 | $2,700 | $23,508 |
| 2020 | $9,658 | $26,208 | $2,700 | $23,508 |
| 2019 | $9,112 | $24,180 | $2,700 | $21,480 |
| 2018 | $8,672 | $24,180 | $2,700 | $21,480 |
| 2017 | $7,969 | $22,122 | $2,700 | $19,422 |
| 2016 | $7,994 | $22,122 | $2,700 | $19,422 |
| 2015 | $7,995 | $22,122 | $2,700 | $19,422 |
| 2014 | $7,955 | $22,122 | $2,700 | $19,422 |
Source: Public Records
Map
Nearby Homes
- 137 Clearcreek Dr
- 509 Wentworth Farm Cir
- 162 Clearcreek Dr
- 409 Wickham Way
- 640 Hardwood Dr
- 945 Riverland Woods Trail
- 225 Watersedge Dr
- 811 Shady Oak Ct
- 803 Shady Oak Ct
- 3044 English Cottage Way
- 1442 Bella Grace Ct
- 1422 Bella Grace Ct
- 1418 Bella Grace Ct
- 3031 English Cottage Way
- 3027 English Cottage Way
- 371 Benford Dr
- 1341 Wunder Way
- 477 Waterford Point Dr
- 1019 Tudor Cottage Tr
- 131 Clearcreek Dr
- 512 Wentworth Farm Cir
- 501 Wentworth Farm Cir
- 505 Wentworth Farm Cir
- 118 Clearcreek Dr
- 513 Wentworth Farm Cir
- 528 Wentworth Farm Cir
- 113 Clearcreek Dr
- 540 Wentworth Farm Cir
- 124 Clearcreek Dr
- 517 Wentworth Farm Cir
- 680 Hardwood Dr
- 684 Hardwood Dr
- 686 Hardwood Dr
- 688 Hardwood Dr
- 143 Clearcreek Dr
- 690 Hardwood Dr
- 676 Hardwood Dr
- 694 Hardwood Dr
- 672 Hardwood Dr