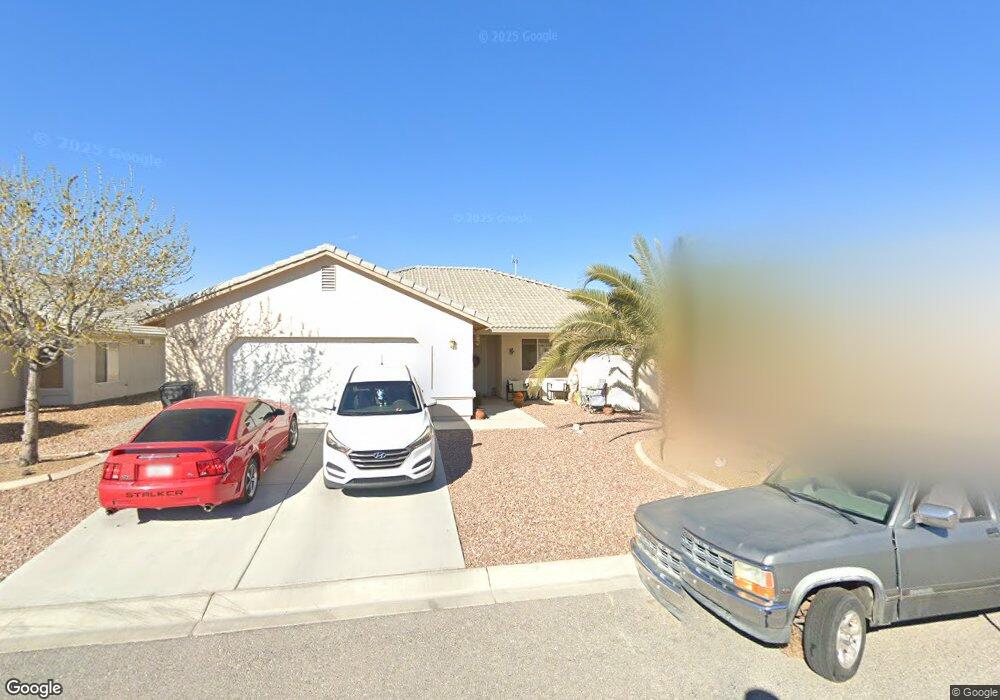
5060 Valdez Ct Pahrump, NV 89060
Estimated Value: $344,507 - $359,000
3
Beds
2
Baths
1,921
Sq Ft
$182/Sq Ft
Est. Value
About This Home
This home is located at 5060 Valdez Ct, Pahrump, NV 89060 and is currently estimated at $349,127, approximately $181 per square foot. 5060 Valdez Ct is a home located in Nye County with nearby schools including Manse Elementary School, Rosemary Clarke Middle School, and Pahrump Valley High School.
Ownership History
Date
Name
Owned For
Owner Type
Purchase Details
Closed on
Feb 26, 2009
Sold by
Us Bank National Association
Bought by
Patterson Charlene
Current Estimated Value
Home Financials for this Owner
Home Financials are based on the most recent Mortgage that was taken out on this home.
Original Mortgage
$98,188
Outstanding Balance
$62,136
Interest Rate
5.04%
Mortgage Type
FHA
Estimated Equity
$286,991
Purchase Details
Closed on
Jul 7, 2008
Sold by
Nelson Annette
Bought by
Us Bank Na and Bear Stearns Abs 2006-Ac4
Purchase Details
Closed on
Apr 7, 2006
Sold by
Nelson Larry
Bought by
Nelson Annette
Purchase Details
Closed on
Jan 27, 2006
Sold by
Double M Construction
Bought by
Nelson Annette
Home Financials for this Owner
Home Financials are based on the most recent Mortgage that was taken out on this home.
Original Mortgage
$210,000
Interest Rate
6.2%
Mortgage Type
Fannie Mae Freddie Mac
Create a Home Valuation Report for This Property
The Home Valuation Report is an in-depth analysis detailing your home's value as well as a comparison with similar homes in the area
Home Values in the Area
Average Home Value in this Area
Purchase History
| Date | Buyer | Sale Price | Title Company |
|---|---|---|---|
| Patterson Charlene | $100,000 | Chicago Title | |
| Us Bank Na | $155,350 | Cow County Title | |
| Nelson Annette | -- | Multiple | |
| Nelson Annette | $262,500 | Multiple |
Source: Public Records
Mortgage History
| Date | Status | Borrower | Loan Amount |
|---|---|---|---|
| Open | Patterson Charlene | $98,188 | |
| Previous Owner | Nelson Annette | $210,000 |
Source: Public Records
Tax History Compared to Growth
Tax History
| Year | Tax Paid | Tax Assessment Tax Assessment Total Assessment is a certain percentage of the fair market value that is determined by local assessors to be the total taxable value of land and additions on the property. | Land | Improvement |
|---|---|---|---|---|
| 2025 | $1,625 | $73,985 | $4,466 | $69,519 |
| 2024 | $1,625 | $75,007 | $4,466 | $70,541 |
| 2023 | $1,625 | $69,314 | $4,466 | $64,848 |
| 2022 | $1,530 | $63,581 | $4,466 | $59,115 |
| 2021 | $1,489 | $60,456 | $3,573 | $56,883 |
| 2020 | $1,447 | $60,359 | $3,573 | $56,786 |
| 2019 | $1,405 | $71,070 | $3,573 | $67,497 |
| 2018 | $1,365 | $64,857 | $2,858 | $61,999 |
| 2017 | $1,326 | $52,225 | $2,858 | $49,367 |
| 2016 | $1,294 | $39,901 | $2,858 | $37,043 |
| 2015 | $1,291 | $36,990 | $2,858 | $34,132 |
| 2014 | $1,254 | $38,476 | $2,858 | $35,618 |
Source: Public Records
Map
Nearby Homes
- 5001 Ray Frank Blvd
- 1130 E Harris Farm Rd
- 5260 N Blagg Rd
- 360 NE Nimo Ct
- 370 NE Nimo Ct
- 5411 NW Beko Ave
- 380 NE Nimo Ct
- 410 Steven Ave
- 5341 Ronnie Rd
- 521 Steven Ave
- 5350 Mooncrest Ave
- 5450 N Nevada Hwy 160
- 360 E Country Place Rd
- 5681 Kens Place
- 5261 N Nevada Hwy 160
- 4861 Ruth Rd
- 5711 N Nopah Vista Ave
- 5691 N Nopah Vista Ave
- 630 Desert Trails Blvd
- 591 E Country Place Rd
- 5080 Valdez Ct
- 5050 Valdez Ct
- 5061 Ray Frank Blvd
- 5051 NW Ray Frank Blvd
- 5051 Ray Frank Blvd
- 5081 Ray Frank Blvd
- 5040 Valdez Ct
- 5100 Valdez Ct
- 5061 Valdez Ct
- 5041 Ray Frank Blvd
- 5101 Ray Frank Blvd
- 5081 Valdez Ct
- 5051 Valdez Ct
- 5020 Valdez Ct
- 5101 Valdez Ct
- 5110 Valdez Ct
- 5041 Valdez Ct
- 5111 Ray Frank Blvd
- 5111 Valdez Ct
- 5021 Valdez Ct