Estimated Value: $392,565 - $401,000
3
Beds
2
Baths
1,532
Sq Ft
$258/Sq Ft
Est. Value
About This Home
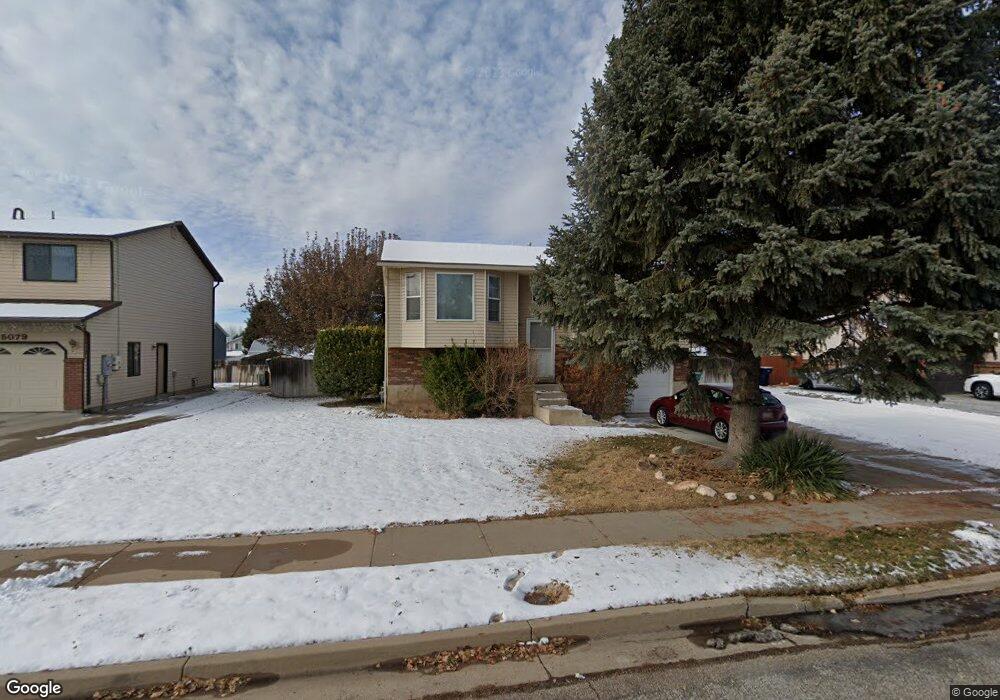
This home is located at 5061 S 2925 W, Roy, UT 84067 and is currently estimated at $395,391, approximately $258 per square foot. 5061 S 2925 W is a home located in Weber County with nearby schools including Midland School, Sand Ridge Junior High School, and Roy High School.
Ownership History
Date
Name
Owned For
Owner Type
Purchase Details
Closed on
Jan 31, 2024
Sold by
Alfaro Benjamin
Bought by
Alfaro Benjamin and Valdez Claudia Lveth
Current Estimated Value
Home Financials for this Owner
Home Financials are based on the most recent Mortgage that was taken out on this home.
Original Mortgage
$21,800
Outstanding Balance
$21,415
Interest Rate
6.61%
Estimated Equity
$373,976
Purchase Details
Closed on
Jan 30, 2024
Sold by
Carey Debra Marie
Bought by
Alfaro Benjamin
Home Financials for this Owner
Home Financials are based on the most recent Mortgage that was taken out on this home.
Original Mortgage
$21,800
Outstanding Balance
$21,415
Interest Rate
6.61%
Estimated Equity
$373,976
Purchase Details
Closed on
Feb 26, 2001
Sold by
Pagano Michael A and Pagano Jan
Bought by
Carey Debra M
Home Financials for this Owner
Home Financials are based on the most recent Mortgage that was taken out on this home.
Original Mortgage
$106,528
Interest Rate
6.98%
Mortgage Type
FHA
Create a Home Valuation Report for This Property
The Home Valuation Report is an in-depth analysis detailing your home's value as well as a comparison with similar homes in the area
Home Values in the Area
Average Home Value in this Area
Purchase History
| Date | Buyer | Sale Price | Title Company |
|---|---|---|---|
| Alfaro Benjamin | -- | Meraki Title | |
| Alfaro Benjamin | -- | None Listed On Document | |
| Carey Debra M | -- | Backman Stewart Title |
Source: Public Records
Mortgage History
| Date | Status | Borrower | Loan Amount |
|---|---|---|---|
| Open | Alfaro Benjamin | $21,800 | |
| Open | Alfaro Benjamin | $364,770 | |
| Previous Owner | Carey Debra M | $106,528 |
Source: Public Records
Tax History Compared to Growth
Tax History
| Year | Tax Paid | Tax Assessment Tax Assessment Total Assessment is a certain percentage of the fair market value that is determined by local assessors to be the total taxable value of land and additions on the property. | Land | Improvement |
|---|---|---|---|---|
| 2025 | $2,437 | $383,207 | $135,246 | $247,961 |
| 2024 | $2,341 | $203,499 | $74,385 | $129,114 |
| 2023 | $2,234 | $353,000 | $122,102 | $230,898 |
| 2022 | $804 | $222,200 | $56,726 | $165,474 |
| 2021 | $709 | $290,000 | $77,323 | $212,677 |
| 2020 | $1,841 | $250,000 | $77,323 | $172,677 |
| 2019 | $1,722 | $219,000 | $46,955 | $172,045 |
| 2018 | $1,618 | $193,000 | $46,955 | $146,045 |
| 2017 | $1,486 | $165,000 | $46,955 | $118,045 |
| 2016 | $1,458 | $87,201 | $22,658 | $64,543 |
| 2015 | $1,298 | $78,766 | $22,658 | $56,108 |
| 2014 | $1,248 | $74,491 | $22,658 | $51,833 |
Source: Public Records
Map
Nearby Homes