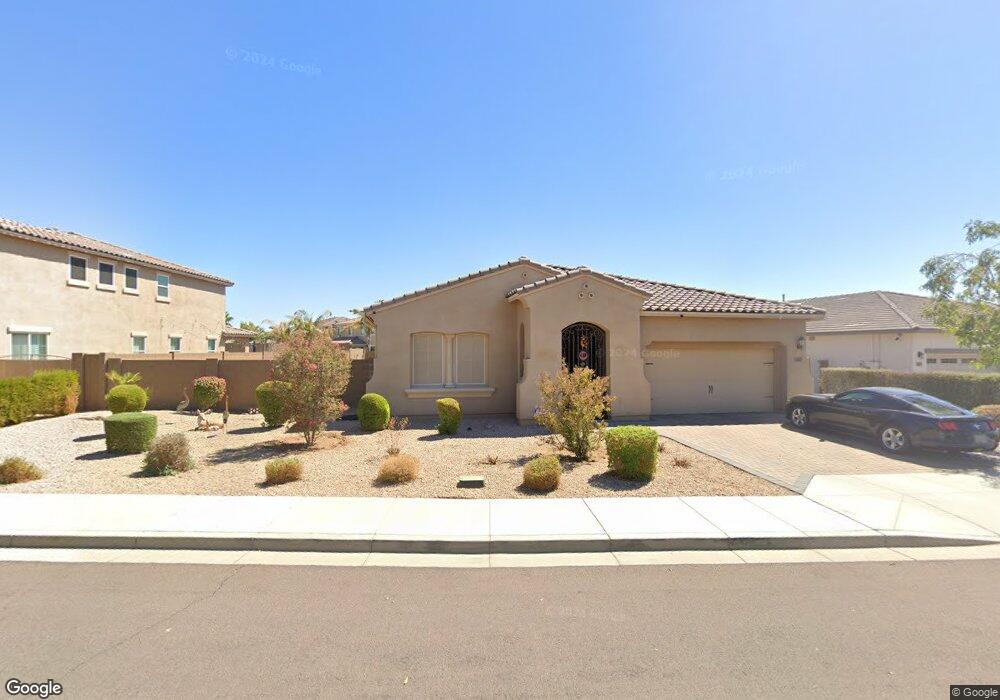
5063 N 148th Ave Litchfield Park, AZ 85340
Estimated Value: $618,870 - $650,000
--
Bed
1
Bath
2,638
Sq Ft
$240/Sq Ft
Est. Value
About This Home
This home is located at 5063 N 148th Ave, Litchfield Park, AZ 85340 and is currently estimated at $633,218, approximately $240 per square foot. 5063 N 148th Ave is a home with nearby schools including Mabel Padgett Elementary School, Western Sky Middle School, and St. Peter's Montessori School.
Ownership History
Date
Name
Owned For
Owner Type
Purchase Details
Closed on
Jan 13, 2021
Sold by
Cooper Melvin J and Cooper Brenda J
Bought by
Cooper Melvin J and Cooper Brenda J
Current Estimated Value
Home Financials for this Owner
Home Financials are based on the most recent Mortgage that was taken out on this home.
Original Mortgage
$229,827
Outstanding Balance
$205,121
Interest Rate
2.71%
Mortgage Type
New Conventional
Estimated Equity
$428,097
Purchase Details
Closed on
Mar 21, 2019
Sold by
Cooper Melvin and Cooper Brenda
Bought by
Cooper Melvin J and Cooper Brenda J
Purchase Details
Closed on
Dec 13, 2016
Sold by
Mattamy Arizona Llc
Bought by
Cooper Melvin and Cooper Brenda
Home Financials for this Owner
Home Financials are based on the most recent Mortgage that was taken out on this home.
Original Mortgage
$338,984
Interest Rate
3.47%
Mortgage Type
New Conventional
Create a Home Valuation Report for This Property
The Home Valuation Report is an in-depth analysis detailing your home's value as well as a comparison with similar homes in the area
Home Values in the Area
Average Home Value in this Area
Purchase History
| Date | Buyer | Sale Price | Title Company |
|---|---|---|---|
| Cooper Melvin J | -- | Amrock Inc | |
| Cooper Melvin J | -- | Amrock Inc | |
| Cooper Melvin J | -- | None Available | |
| Cooper Melvin | $356,826 | Security Title Agency Inc |
Source: Public Records
Mortgage History
| Date | Status | Borrower | Loan Amount |
|---|---|---|---|
| Open | Cooper Melvin J | $229,827 | |
| Closed | Cooper Melvin | $338,984 |
Source: Public Records
Tax History Compared to Growth
Tax History
| Year | Tax Paid | Tax Assessment Tax Assessment Total Assessment is a certain percentage of the fair market value that is determined by local assessors to be the total taxable value of land and additions on the property. | Land | Improvement |
|---|---|---|---|---|
| 2025 | $3,135 | $31,545 | -- | -- |
| 2024 | $2,909 | $30,043 | -- | -- |
| 2023 | $2,909 | $47,850 | $9,570 | $38,280 |
| 2022 | $2,842 | $38,130 | $7,620 | $30,510 |
| 2021 | $3,024 | $34,820 | $6,960 | $27,860 |
| 2020 | $2,925 | $33,370 | $6,670 | $26,700 |
| 2019 | $2,868 | $31,080 | $6,210 | $24,870 |
| 2018 | $2,763 | $30,710 | $6,140 | $24,570 |
| 2017 | $1,217 | $14,020 | $2,800 | $11,220 |
| 2016 | $323 | $2,910 | $2,910 | $0 |
| 2015 | $327 | $3,120 | $3,120 | $0 |
Source: Public Records
Map
Nearby Homes
- 14757 W Pasadena Ave
- 14727 W Pasadena Ave
- 14918 W Escondido Dr N
- 14837 W Escondido Dr N
- 14674 W Pasadena Ave
- 4959 N Village Rd
- 14590 W Pasadena Ave
- 14591 W Oregon Ave
- 14852 W Aldea Dr N
- 14585 W Oregon Ave
- 14708 W Georgia Ave
- 5065 N 145th Dr
- 14870 W Aldea Cir
- 15088 W Coolidge St
- 15028 W Minnezona Ave
- 14640 W Hidden Terrace Loop
- 4481 N Luna Rd W
- 15296 W Coolidge St
- 15148 W Sells Dr
- 14659 W Hidden Terrace Loop
- 5075 N 148th Ave
- 5057 N 148th Ave
- 14776 W Pasadena Ave
- 5081 N 148th Ave
- 5064 N 148th Ave
- 5070 N 148th Ave
- 14770 W Pasadena Ave
- 14765 W Reade Ave
- 5058 N 148th Ave
- 5076 N 148th Ave
- 5082 N 148th Ave
- 14764 W Pasadena Ave
- 14787 W Pasadena Ave
- 14781 W Pasadena Ave
- 14793 W Pasadena Ave
- 14775 W Pasadena Ave
- 14759 W Reade Ave
- 5088 N 148th Ave
- 14758 W Pasadena Ave
- 14769 W Pasadena Ave