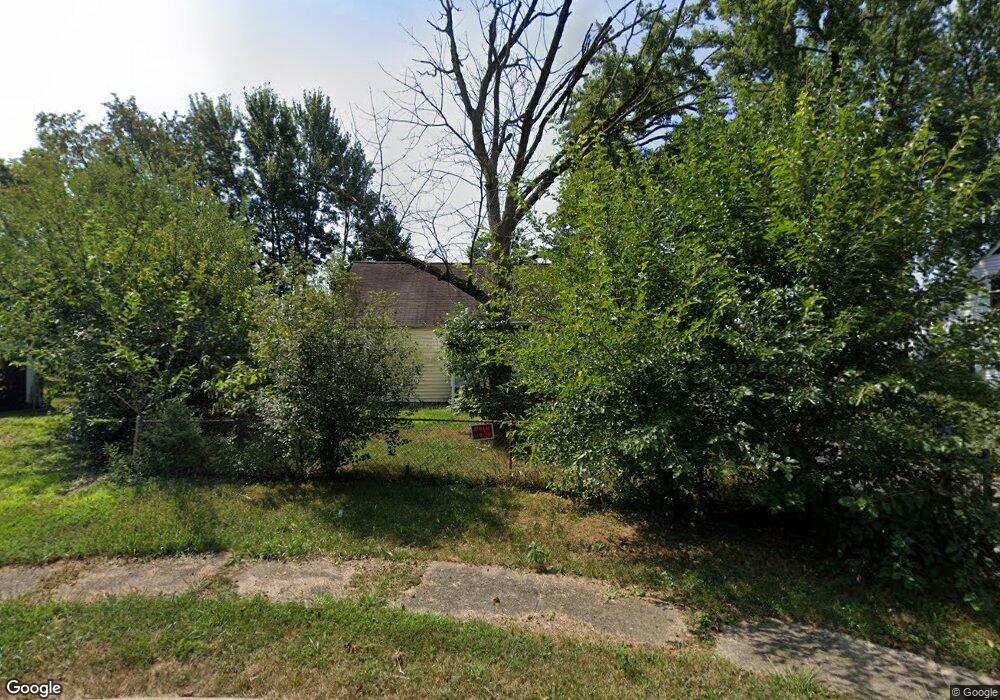
5065 Dimson Dr S Columbus, OH 43213
Estimated Value: $173,000 - $188,000
3
Beds
1
Bath
1,054
Sq Ft
$170/Sq Ft
Est. Value
About This Home
This home is located at 5065 Dimson Dr S, Columbus, OH 43213 and is currently estimated at $179,262, approximately $170 per square foot. 5065 Dimson Dr S is a home located in Franklin County with nearby schools including Etna Road Elementary School, Beechwood Elementary School, and Rosemore Middle School.
Ownership History
Date
Name
Owned For
Owner Type
Purchase Details
Closed on
Feb 27, 2018
Sold by
Beck Marionai
Bought by
Montanez Rochel
Current Estimated Value
Purchase Details
Closed on
Aug 15, 2007
Sold by
Hildebrand Kathleen F
Bought by
Beck Marion A
Purchase Details
Closed on
Aug 14, 2007
Sold by
Neenan James E
Bought by
Beck Marion A
Purchase Details
Closed on
Aug 13, 2007
Sold by
Neenan George M and Neenan Gail
Bought by
Beck Marion A
Purchase Details
Closed on
Jul 27, 2007
Sold by
Estate Of Mary E Neenan
Bought by
Neenan John W and Neenan Theresa M
Purchase Details
Closed on
Jul 26, 2007
Sold by
Neenan Theresa M
Bought by
Beck Marion A
Purchase Details
Closed on
Dec 29, 2004
Sold by
Estate Of George J Neenan Jr
Bought by
Neenan Mary E
Purchase Details
Closed on
Nov 26, 1969
Bought by
Neenan George J
Create a Home Valuation Report for This Property
The Home Valuation Report is an in-depth analysis detailing your home's value as well as a comparison with similar homes in the area
Home Values in the Area
Average Home Value in this Area
Purchase History
| Date | Buyer | Sale Price | Title Company |
|---|---|---|---|
| Montanez Rochel | -- | None Available | |
| Beck Marion A | -- | None Available | |
| Beck Marion A | -- | None Available | |
| Beck Marion A | -- | None Available | |
| Beck Marion A | -- | None Available | |
| Neenan John W | -- | None Available | |
| Beck Marion A | -- | None Available | |
| Neenan Mary E | -- | -- | |
| Neenan George J | -- | -- |
Source: Public Records
Tax History
| Year | Tax Paid | Tax Assessment Tax Assessment Total Assessment is a certain percentage of the fair market value that is determined by local assessors to be the total taxable value of land and additions on the property. | Land | Improvement |
|---|---|---|---|---|
| 2025 | $2,387 | $49,980 | $15,540 | $34,440 |
| 2024 | $2,387 | $49,980 | $15,540 | $34,440 |
| 2023 | $2,372 | $49,980 | $15,540 | $34,440 |
| 2022 | $4,221 | $24,080 | $7,140 | $16,940 |
| 2021 | $1,827 | $24,080 | $7,140 | $16,940 |
| 2020 | $1,637 | $24,080 | $7,140 | $16,940 |
| 2019 | $1,322 | $18,700 | $5,710 | $12,990 |
| 2018 | $1,168 | $18,700 | $5,710 | $12,990 |
| 2017 | $1,184 | $18,700 | $5,710 | $12,990 |
| 2016 | $1,181 | $16,840 | $4,270 | $12,570 |
| 2015 | $1,141 | $16,840 | $4,270 | $12,570 |
| 2014 | $1,141 | $16,840 | $4,270 | $12,570 |
| 2013 | $604 | $18,725 | $4,760 | $13,965 |
Source: Public Records
Map
Nearby Homes
- 931 Antwerp Rd
- 4991 Justin Rd
- 1209 Norman Dr
- 845 Exeter Rd
- 1320 Nancy Ln
- 1260 Country Club Rd
- 1310 Manfeld Dr
- 1211 Shady Lane Rd
- 1193 Marble Dr
- 4859 Folger Dr
- 1470 Efner Dr
- 1472 Blaine Dr
- 547 Country Club Rd
- 4662 Jae Ave
- 1229 Simpson Dr
- 1243 Simpson Dr
- 1085 S Hamilton Rd
- 1284 Thurston Dr
- 706 Ross Rd
- 4677 E Livingston Ave
- 5059 Dimson Dr S
- 5069 Dimson Dr S
- 5051 Dimson Dr S
- 5043 Dimson Dr S
- 1028 Dimson Dr E
- 5180 E Main St Unit 5824 sq ft vacancy
- 5180 E Main St Unit Entire 3004 sq ft Lo
- 5180 E Main St Unit Entire 2820 sq ft Up
- 5180 E Main St Unit Suite E2
- 5180 E Main St Unit Suite E1
- 5180 E Main St Unit Suite C
- 5180 E Main St Unit Suite B
- 5180 E Main St Unit Suite A
- 5180 E Main St
- 5035 Dimson Dr S
- 5064 Dimson Dr S
- 5054 Dimson Dr S
- 5160 E Main St
- 5044 Dimson Dr S
- 1031 Dimson Dr E
Your Personal Tour Guide
Ask me questions while you tour the home.