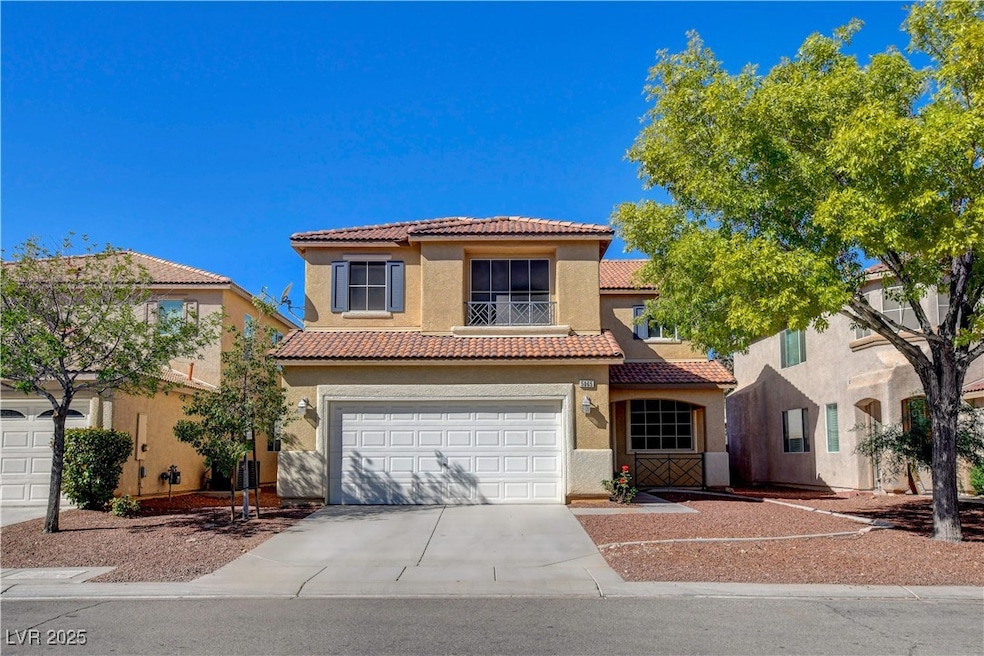
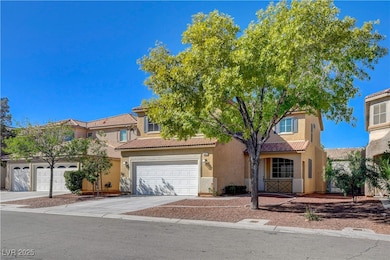
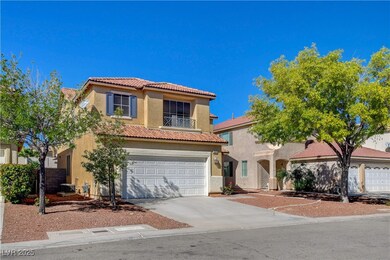
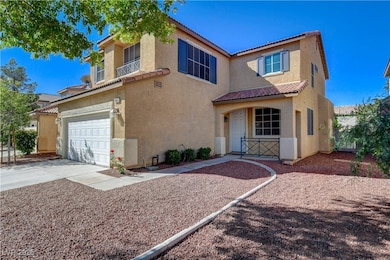
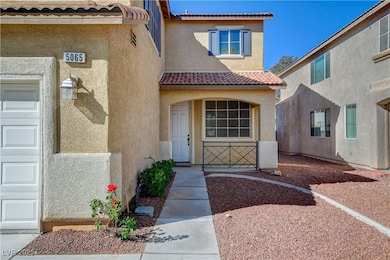
5065 Shadow Valley St Las Vegas, NV 89148
Estimated payment $3,455/month
Highlights
- Heated Above Ground Pool
- Main Floor Bedroom
- 2 Car Attached Garage
- Freestanding Bathtub
- Covered Patio or Porch
- Double Pane Windows
About This Home
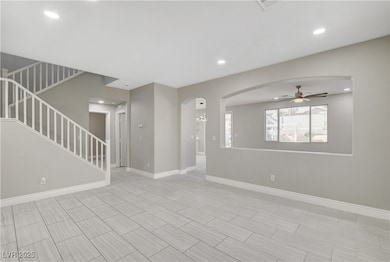
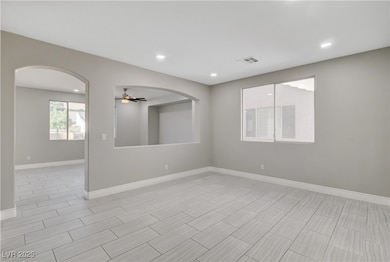
HIGHLY UPGRADED NEWER SHAKER STYLE WHITE CABINETS, NICE CONTEMPORARY TILES, AND LAMINATE WOOD FLOOR (NO CARPET), ENJOY A FULLY NEW REMODELED MASTER BATHROOM WITH A LUXURIOUS WALK-IN SHOWER, AND FREESTANDING SOAKING TUB AND ELEGANT WALL PANELING ALL ACCENTS, STEP OUTSIDE TO THIS SPACIOUS OVERSIZED BACKYARD WITH NICE SPARKLING POOL FOR THE HOT SUMMER, A MUST SEE
Listing Agent
Nevada Real Estate Corp Brokerage Phone: 702-368-6883 License #BS.0145804 Listed on: 10/22/2025
Home Details
Home Type
- Single Family
Est. Annual Taxes
- $3,195
Year Built
- Built in 2003
Lot Details
- 6,970 Sq Ft Lot
- East Facing Home
- Back Yard Fenced
- Block Wall Fence
- Desert Landscape
HOA Fees
- $25 Monthly HOA Fees
Parking
- 2 Car Attached Garage
Home Design
- Tile Roof
Interior Spaces
- 2,437 Sq Ft Home
- 2-Story Property
- Double Pane Windows
Kitchen
- Gas Range
- Dishwasher
- Disposal
Flooring
- Laminate
- Tile
Bedrooms and Bathrooms
- 4 Bedrooms
- Main Floor Bedroom
- Freestanding Bathtub
- Soaking Tub
Laundry
- Laundry on upper level
- Gas Dryer Hookup
Pool
- Heated Above Ground Pool
- Spa
Schools
- Batterman Elementary School
- Fertitta Frank & Victoria Middle School
- Durango High School
Utilities
- Central Heating and Cooling System
- Heating System Uses Gas
- Underground Utilities
Additional Features
- Energy-Efficient Windows
- Covered Patio or Porch
Community Details
- Association fees include management
- Shadow Mountain Association, Phone Number (702) 433-0149
- Section 30 Southwest Assemblage Model Site 1 Subdivision
- The community has rules related to covenants, conditions, and restrictions
Map
Home Values in the Area
Average Home Value in this Area
Tax History
| Year | Tax Paid | Tax Assessment Tax Assessment Total Assessment is a certain percentage of the fair market value that is determined by local assessors to be the total taxable value of land and additions on the property. | Land | Improvement |
|---|---|---|---|---|
| 2025 | $3,195 | $164,260 | $54,950 | $109,310 |
| 2024 | $2,959 | $164,260 | $54,950 | $109,310 |
| 2023 | $2,959 | $149,874 | $47,250 | $102,624 |
| 2022 | $2,873 | $135,129 | $40,950 | $94,179 |
| 2021 | $2,660 | $124,821 | $35,700 | $89,121 |
| 2020 | $2,467 | $122,599 | $34,300 | $88,299 |
| 2019 | $2,312 | $116,878 | $29,750 | $87,128 |
| 2018 | $2,206 | $108,607 | $25,200 | $83,407 |
| 2017 | $3,209 | $109,408 | $24,850 | $84,558 |
| 2016 | $2,065 | $96,707 | $21,000 | $75,707 |
| 2015 | $2,061 | $97,707 | $15,400 | $82,307 |
| 2014 | $2,001 | $66,191 | $13,300 | $52,891 |
Property History
| Date | Event | Price | List to Sale | Price per Sq Ft |
|---|---|---|---|---|
| 10/22/2025 10/22/25 | For Sale | $599,000 | -- | $246 / Sq Ft |
Purchase History
| Date | Type | Sale Price | Title Company |
|---|---|---|---|
| Quit Claim Deed | -- | -- | |
| Quit Claim Deed | -- | -- | |
| Bargain Sale Deed | -- | None Listed On Document | |
| Trustee Deed | $455,000 | None Listed On Document | |
| Bargain Sale Deed | $218,781 | National Title Company |
Mortgage History
| Date | Status | Loan Amount | Loan Type |
|---|---|---|---|
| Previous Owner | $253,377 | No Value Available |
Source: Las Vegas REALTORS®
MLS Number: 2729750
APN: 163-30-111-017
Disclaimer: Certain information contained herein is derived from information provided by parties other than Homes.com. All information provided is deemed reliable, but is not guaranteed to be accurate and should be independently verified.
![]() The data relating to real estate for sale on this web site comes in part from the INTERNET DATA EXCHANGE Program of the Greater Las Vegas Association of REALTORS® MLS. Real estate listings held by brokerage firms other than this site owner are marked with the IDX logo. Information is deemed reliable but not guaranteed. Copyright 2025 of the Greater Las Vegas Association of REALTORS® MLS. All rights reserved.
The data relating to real estate for sale on this web site comes in part from the INTERNET DATA EXCHANGE Program of the Greater Las Vegas Association of REALTORS® MLS. Real estate listings held by brokerage firms other than this site owner are marked with the IDX logo. Information is deemed reliable but not guaranteed. Copyright 2025 of the Greater Las Vegas Association of REALTORS® MLS. All rights reserved.
- 9927 Ridge Manor Ave
- 9821 Sedona Shrine Ave
- 5076 Thunder River Cir
- 9784 Havasupai Ave
- 10033 Flagstaff Butte Ave
- 5014 Thunder River Cir
- 10034 White Mulberry Dr
- 9731 Cathedral Stairs Ct
- 4909 Mountain Pepper Dr
- 9693 Bighorn Island Ave
- 10103 Flagstaff Butte Ave
- 4916 Desert Lime Ct
- 10017 Twilight Vista Ave
- 10139 White Mulberry Dr
- 4913 Calabash Tree Ct
- 9748 Villa Lorena Ave
- 5140 Fiery Sky Ridge St
- 9717 Villa Lorena Ave
- 9699 Villa Lorena Ave
- 9862 Shadow Grove Ave
- 5096 Shadow Valley St
- 5029 Tranquil Stream Ct
- 9844 Sedona Shrine Ave
- 9805 Sedona Shrine Ave
- 5096 Thunder River Cir
- 10014 Hermit Rapids Ave
- 9848 Sonora Bend Ave
- 10073 White Mulberry Dr
- 9860 W Tropicana Ave
- 9950 W Tropicana Ave
- 9693 Bighorn Island Ave
- 5206 Marsh Butte St
- 9830 W Tropicana Ave
- 5196 Guardian Peak St
- 9782 Vista Crest Ave
- 5117 Fiery Sky Ridge St
- 9756 Villa La Mora Ave
- 9708 Villa Lorena Ave
- 9950 Shadow Grove Ave
- 9591 Antelope Bend Ct
