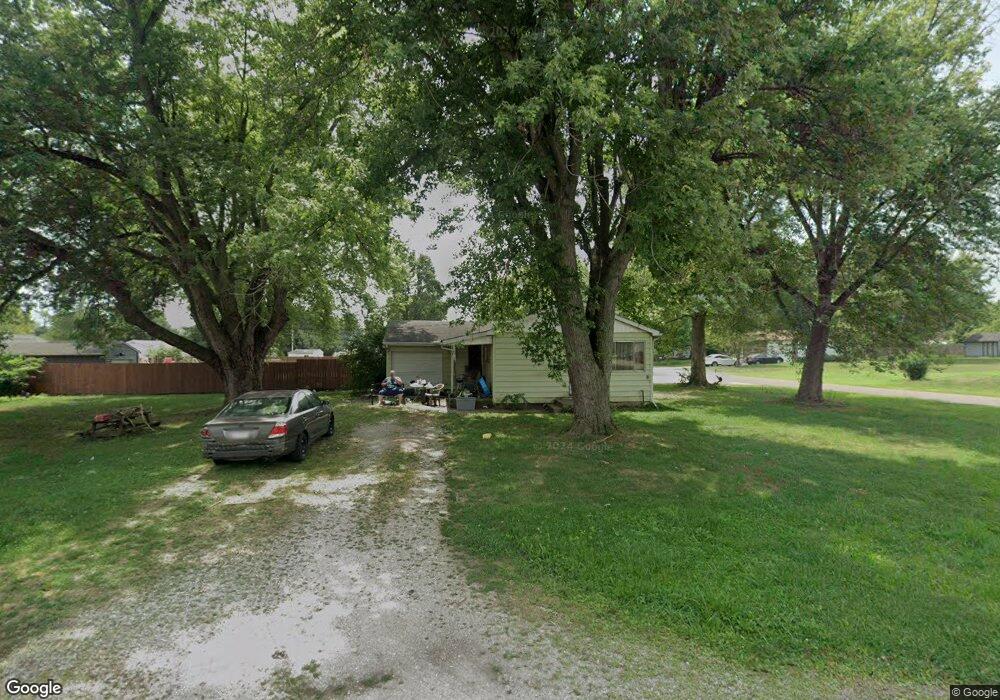
5067 Crites Dr South Bloomfield, OH 43103
Estimated Value: $156,778 - $259,000
3
Beds
1
Bath
800
Sq Ft
$253/Sq Ft
Est. Value
About This Home
This home is located at 5067 Crites Dr, South Bloomfield, OH 43103 and is currently estimated at $202,445, approximately $253 per square foot. 5067 Crites Dr is a home located in Pickaway County.
Ownership History
Date
Name
Owned For
Owner Type
Purchase Details
Closed on
May 31, 2017
Sold by
Bowser Teresa Irwin
Bought by
Gantner Matthew M and Bowser Virginia L
Current Estimated Value
Home Financials for this Owner
Home Financials are based on the most recent Mortgage that was taken out on this home.
Original Mortgage
$38,250
Outstanding Balance
$31,816
Interest Rate
4.02%
Mortgage Type
Future Advance Clause Open End Mortgage
Estimated Equity
$170,629
Purchase Details
Closed on
Sep 30, 2009
Sold by
Fenstermaker Eric B
Bought by
Irwin Bowser Teresa
Purchase Details
Closed on
Sep 20, 2007
Sold by
Estate Of James E Irwin
Bought by
Fentermaker Eric B and The James E Irwin Trust
Purchase Details
Closed on
Nov 22, 2000
Sold by
Shrf Darlene Ramsey Pr
Bought by
Irwin James E
Purchase Details
Closed on
Oct 8, 1993
Sold by
Wright Helen I
Bought by
Ramsey Darlene C
Create a Home Valuation Report for This Property
The Home Valuation Report is an in-depth analysis detailing your home's value as well as a comparison with similar homes in the area
Home Values in the Area
Average Home Value in this Area
Purchase History
| Date | Buyer | Sale Price | Title Company |
|---|---|---|---|
| Gantner Matthew M | $45,000 | Citizens Land Title | |
| Irwin Bowser Teresa | $65,000 | Clt | |
| Fentermaker Eric B | -- | None Available | |
| Irwin James E | $65,500 | -- | |
| Ramsey Darlene C | $54,000 | -- |
Source: Public Records
Mortgage History
| Date | Status | Borrower | Loan Amount |
|---|---|---|---|
| Open | Gantner Matthew M | $38,250 |
Source: Public Records
Tax History Compared to Growth
Tax History
| Year | Tax Paid | Tax Assessment Tax Assessment Total Assessment is a certain percentage of the fair market value that is determined by local assessors to be the total taxable value of land and additions on the property. | Land | Improvement |
|---|---|---|---|---|
| 2024 | -- | $31,110 | $9,030 | $22,080 |
| 2023 | $673 | $31,110 | $9,030 | $22,080 |
| 2022 | $999 | $23,430 | $7,530 | $15,900 |
| 2021 | $948 | $23,430 | $7,530 | $15,900 |
| 2020 | $951 | $23,430 | $7,530 | $15,900 |
| 2019 | $950 | $22,520 | $7,530 | $14,990 |
| 2018 | $953 | $22,520 | $7,530 | $14,990 |
| 2017 | $978 | $22,520 | $7,530 | $14,990 |
| 2016 | $963 | $22,070 | $7,440 | $14,630 |
| 2015 | $963 | $22,070 | $7,440 | $14,630 |
| 2014 | $964 | $22,070 | $7,440 | $14,630 |
| 2013 | $1,031 | $22,070 | $7,440 | $14,630 |
Source: Public Records
Map
Nearby Homes
- 5049 Lee Rd
- 5069 Ashville Rd
- 5050 S Walnut St
- 0 U S 23
- 14337 Us Highway 23
- 14337 Us Highway 23
- The Daffodil Plan at Riverbend at Scioto Landing
- The Daisy Plan at Riverbend at Scioto Landing
- The Avalon Plan at Riverbend at Scioto Landing
- The Aster Plan at Riverbend at Scioto Landing
- 51 Henderson Ln
- Aspire Plan at Bloomfield Hills
- Hampton Plan at Bloomfield Hills
- Mitchell Plan at Bloomfield Hills
- Crisfield Plan at Bloomfield Hills
- Sereneda Plan at Bloomfield Hills
- Oakdale Plan at Bloomfield Hills
- 127 Boutot St
- 5009 Roese Ave
- 30 Bazler Ln