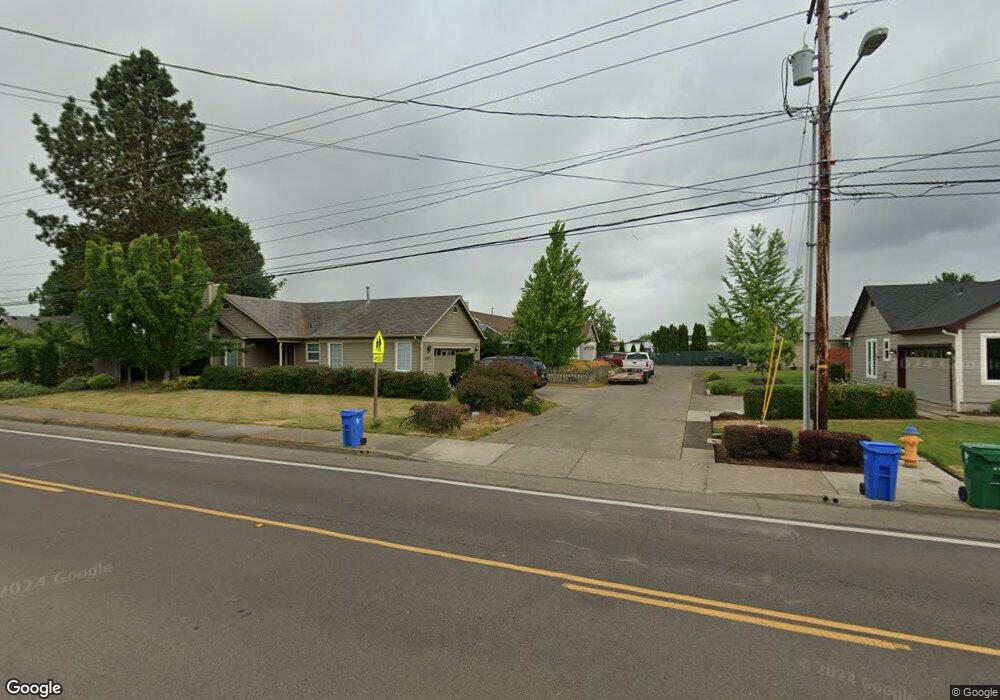
5067 Royal Ave Eugene, OR 97402
Bethel NeighborhoodEstimated Value: $386,378 - $496,000
3
Beds
2
Baths
1,244
Sq Ft
$341/Sq Ft
Est. Value
About This Home
This home is located at 5067 Royal Ave, Eugene, OR 97402 and is currently estimated at $424,595, approximately $341 per square foot. 5067 Royal Ave is a home located in Lane County with nearby schools including Prairie Mountain School and Willamette High School.
Ownership History
Date
Name
Owned For
Owner Type
Purchase Details
Closed on
Feb 22, 2026
Sold by
Long Cheryl M
Bought by
Brancato Heidi
Current Estimated Value
Purchase Details
Closed on
Jul 22, 2016
Sold by
Lear Rebecca J and Lear Michael T
Bought by
Long Cheryl M
Home Financials for this Owner
Home Financials are based on the most recent Mortgage that was taken out on this home.
Original Mortgage
$216,505
Interest Rate
3.37%
Mortgage Type
FHA
Purchase Details
Closed on
Oct 7, 2015
Sold by
Harris John D and Harris Alma Ruth
Bought by
Lear Rebecca J and Lear Michael T
Home Financials for this Owner
Home Financials are based on the most recent Mortgage that was taken out on this home.
Original Mortgage
$205,000
Interest Rate
3.78%
Mortgage Type
VA
Purchase Details
Closed on
Jan 21, 2005
Sold by
Schlosser Harlin
Bought by
Harris John D and Harris Ruth
Purchase Details
Closed on
Feb 9, 2000
Sold by
Pohlman Steven A and Pohlman Rhonda K
Bought by
Schlosser Harlin
Home Financials for this Owner
Home Financials are based on the most recent Mortgage that was taken out on this home.
Original Mortgage
$124,358
Interest Rate
8.14%
Mortgage Type
FHA
Create a Home Valuation Report for This Property
The Home Valuation Report is an in-depth analysis detailing your home's value as well as a comparison with similar homes in the area
Home Values in the Area
Average Home Value in this Area
Purchase History
| Date | Buyer | Sale Price | Title Company |
|---|---|---|---|
| Brancato Heidi | $315,000 | Evergreen Land Title Company | |
| Long Cheryl M | $220,500 | Western Title & Escrow Co | |
| Lear Rebecca J | $205,000 | Western Title & Escrow Co | |
| Harris John D | $155,000 | Western Title & Escrow Compa | |
| Schlosser Harlin | $126,000 | Fidelity National Title Ins |
Source: Public Records
Mortgage History
| Date | Status | Borrower | Loan Amount |
|---|---|---|---|
| Previous Owner | Long Cheryl M | $216,505 | |
| Previous Owner | Lear Rebecca J | $205,000 | |
| Previous Owner | Schlosser Harlin | $124,358 |
Source: Public Records
Tax History
| Year | Tax Paid | Tax Assessment Tax Assessment Total Assessment is a certain percentage of the fair market value that is determined by local assessors to be the total taxable value of land and additions on the property. | Land | Improvement |
|---|---|---|---|---|
| 2025 | $3,771 | $216,798 | -- | -- |
| 2024 | $3,676 | $210,484 | -- | -- |
| 2023 | $3,676 | $204,354 | $0 | $0 |
| 2022 | $3,422 | $198,402 | $0 | $0 |
| 2021 | $3,350 | $192,624 | $0 | $0 |
| 2020 | $3,252 | $187,014 | $0 | $0 |
| 2019 | $3,092 | $181,567 | $0 | $0 |
| 2018 | $3,006 | $171,145 | $0 | $0 |
| 2017 | $2,872 | $171,145 | $0 | $0 |
| 2016 | $2,799 | $166,160 | $0 | $0 |
| 2015 | $2,744 | $161,320 | $0 | $0 |
| 2014 | $2,702 | $156,621 | $0 | $0 |
Source: Public Records
Map
Nearby Homes
- 5260 Forest Ln
- 4900 Royal Ave Unit 105
- 4900 Royal Ave Unit SP13
- 749 St Charles St
- 735 St Charles St
- 723 St Charles St
- 715 St Charles St
- 5254 Forest Ln
- 716 St Charles St
- 683 Saint Charles St
- 1199 N Terry St
- 1199 N Terry St Unit 248
- 1199 N Terry St Unit 259
- 1199 N Terry St Unit 139
- 1199 N Terry St Unit 258
- 1199 N Terry St Unit SP113
- 1199 N Terry St Unit 309
- 1199 N Terry St Unit SP282
- 1199 N Terry St Unit 128
- 1199 N Terry St Unit 366
- 5071 Royal Ave
- 5075 Royal Ave
- 5065 Royal Ave
- 5061 Royal Ave
- 5085 Royal Ave
- 5081 Royal Ave
- 5035 Royal Ave
- 5015 Royal Ave
- 797 Driftwood Dr
- 5074 Royal Ave
- 5062 Royal Ave
- 5093 Royal Ave
- 5097 Royal Ave
- 4995 Royal Ave
- 5046 Royal Ave
- 4975 Royal Ave
- 785 Driftwood Dr
- 5042 Royal Ave
- 5101 Royal Ave
- 773 Driftwood Dr
Your Personal Tour Guide
Ask me questions while you tour the home.