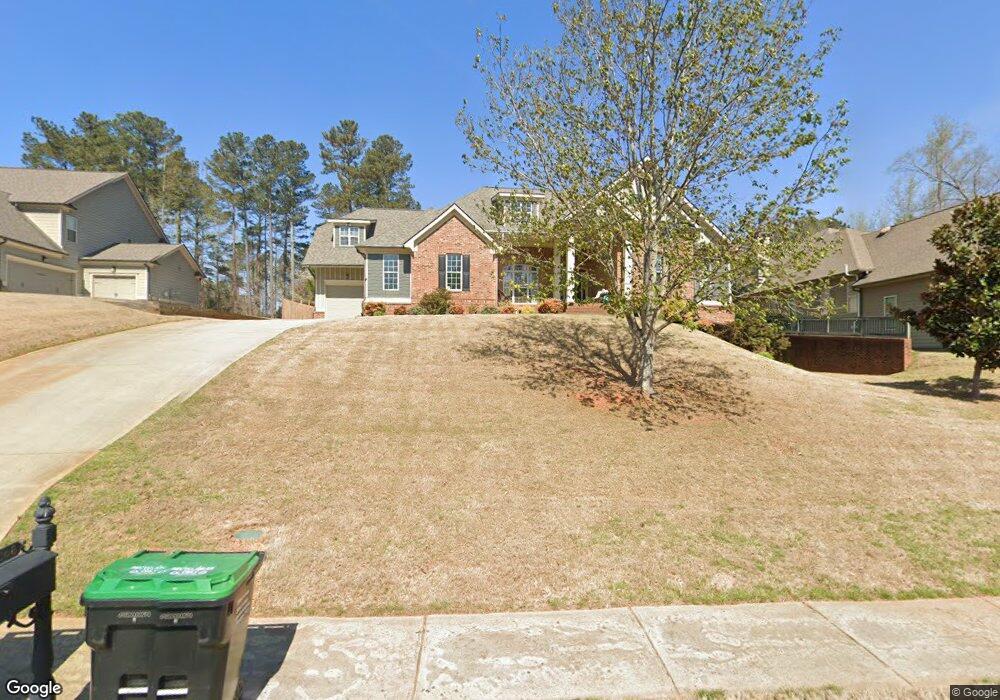
5068 Stefan Ridge Way Buford, GA 30519
Estimated Value: $592,000 - $810,000
4
Beds
4
Baths
3,119
Sq Ft
$232/Sq Ft
Est. Value
About This Home
This home is located at 5068 Stefan Ridge Way, Buford, GA 30519 and is currently estimated at $722,256, approximately $231 per square foot. 5068 Stefan Ridge Way is a home located in Gwinnett County with nearby schools including Duncan Creek Elementary School, Frank N. Osborne Middle School, and Mill Creek High School.
Ownership History
Date
Name
Owned For
Owner Type
Purchase Details
Closed on
Mar 3, 2014
Sold by
Wright Christy Danielle
Bought by
Tone Brian Patrick
Current Estimated Value
Purchase Details
Closed on
Feb 17, 2009
Sold by
Ridgevalley Builders Inc
Bought by
Tone Brian and Wright Christy
Home Financials for this Owner
Home Financials are based on the most recent Mortgage that was taken out on this home.
Original Mortgage
$263,120
Interest Rate
5.07%
Mortgage Type
New Conventional
Purchase Details
Closed on
Mar 25, 2008
Sold by
Heritage Realty Associates
Bought by
Ridgevalley Builders Inc
Home Financials for this Owner
Home Financials are based on the most recent Mortgage that was taken out on this home.
Original Mortgage
$393,600
Interest Rate
5.68%
Create a Home Valuation Report for This Property
The Home Valuation Report is an in-depth analysis detailing your home's value as well as a comparison with similar homes in the area
Home Values in the Area
Average Home Value in this Area
Purchase History
| Date | Buyer | Sale Price | Title Company |
|---|---|---|---|
| Tone Brian Patrick | -- | -- | |
| Tone Brian | $328,900 | -- | |
| Ridgevalley Builders Inc | $85,000 | -- |
Source: Public Records
Mortgage History
| Date | Status | Borrower | Loan Amount |
|---|---|---|---|
| Previous Owner | Tone Brian | $263,120 | |
| Previous Owner | Ridgevalley Builders Inc | $393,600 |
Source: Public Records
Tax History Compared to Growth
Tax History
| Year | Tax Paid | Tax Assessment Tax Assessment Total Assessment is a certain percentage of the fair market value that is determined by local assessors to be the total taxable value of land and additions on the property. | Land | Improvement |
|---|---|---|---|---|
| 2025 | $7,369 | $269,200 | $56,000 | $213,200 |
| 2024 | $7,524 | $269,200 | $56,000 | $213,200 |
| 2023 | $7,524 | $282,280 | $56,000 | $226,280 |
| 2022 | $5,894 | $237,120 | $48,000 | $189,120 |
| 2021 | $6,002 | $191,400 | $38,720 | $152,680 |
| 2020 | $5,456 | $164,040 | $34,000 | $130,040 |
| 2019 | $5,302 | $164,040 | $34,000 | $130,040 |
| 2018 | $4,862 | $164,040 | $34,000 | $130,040 |
| 2016 | $5,056 | $151,120 | $26,400 | $124,720 |
| 2015 | $5,093 | $151,120 | $26,400 | $124,720 |
| 2014 | -- | $121,840 | $26,400 | $95,440 |
Source: Public Records
Map
Nearby Homes
- 4642 Devencrest Ln Unit 1
- 2070 Cabela Dr
- 2046 Barberry Dr
- 6096 Apple Grove Rd
- 6071 Apple Grove Rd
- 5711 Apple Grove Rd
- 5125 Cactus Cove Ln
- 4693 Devencrest Ln
- 5586 Apple Grove Rd
- 2264 Oak Falls Ln
- 5036 Weatherstone Dr
- 2808 Turnwater St
- 5153 Morrell Rd
- 5213 Morrell Rd
- 5222 Morrell Rd
- 4979 Lily Stem Dr
- 5704 Miravista Way
- 5058 Stefan Ridge Way
- 5078 Stefan Ridge Way
- 5048 Stefan Ridge Way
- 5048 Stefan Ridge Way Unit 1/4
- 0 Stefan Ridge Way Unit 7123017
- 0 Stefan Ridge Way Unit 7120790
- 0 Stefan Ridge Way Unit 7120865
- 0 Stefan Ridge Way Unit 7073106
- 0 Stefan Ridge Way Unit 3264740
- 0 Stefan Ridge Way Unit 3264704
- 0 Stefan Ridge Way Unit 3262789
- 0 Stefan Ridge Way Unit 3213404
- 0 Stefan Ridge Way Unit 3213384
- 0 Stefan Ridge Way Unit 3213371
- 0 Stefan Ridge Way Unit 3213319
- 0 Stefan Ridge Way Unit 3213295
- 0 Stefan Ridge Way Unit 3213276
- 0 Stefan Ridge Way Unit 3119876
- 0 Stefan Ridge Way Unit 3119870
- 0 Stefan Ridge Way Unit 3119872