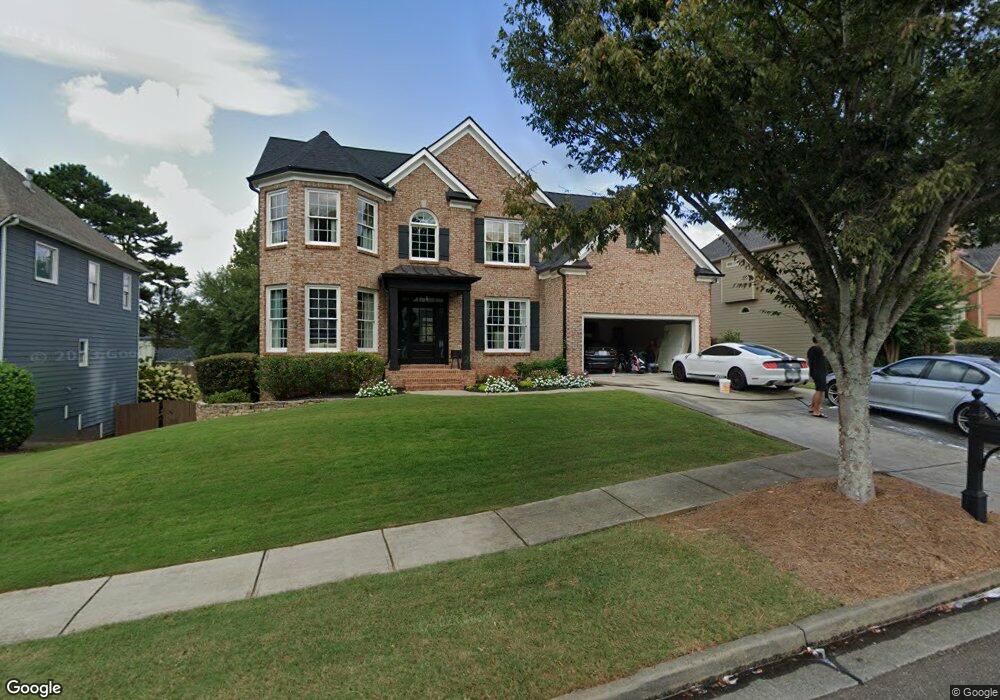
5068 Stone Moss Way Unit 2B Hoschton, GA 30548
Estimated Value: $554,009 - $622,000
5
Beds
4
Baths
3,026
Sq Ft
$191/Sq Ft
Est. Value
About This Home
This home is located at 5068 Stone Moss Way Unit 2B, Hoschton, GA 30548 and is currently estimated at $579,252, approximately $191 per square foot. 5068 Stone Moss Way Unit 2B is a home located in Gwinnett County with nearby schools including Duncan Creek Elementary School, Frank N. Osborne Middle School, and Mill Creek High School.
Ownership History
Date
Name
Owned For
Owner Type
Purchase Details
Closed on
Mar 22, 2024
Sold by
Hudson Quincy
Bought by
Hudson Amanda and Hudson Quincy
Current Estimated Value
Home Financials for this Owner
Home Financials are based on the most recent Mortgage that was taken out on this home.
Original Mortgage
$435,000
Outstanding Balance
$428,124
Interest Rate
6.9%
Mortgage Type
New Conventional
Estimated Equity
$151,128
Purchase Details
Closed on
May 31, 2019
Sold by
Hudson Naomi Yun
Bought by
Hudson Quincy
Purchase Details
Closed on
Dec 1, 2006
Sold by
Hudson Quincy
Bought by
Hudson Quincy and Hudson Naomi Y
Home Financials for this Owner
Home Financials are based on the most recent Mortgage that was taken out on this home.
Original Mortgage
$245,600
Interest Rate
6.31%
Mortgage Type
New Conventional
Purchase Details
Closed on
Jun 6, 2006
Sold by
Kimbro Dequilla
Bought by
Nicholnott Inc
Create a Home Valuation Report for This Property
The Home Valuation Report is an in-depth analysis detailing your home's value as well as a comparison with similar homes in the area
Home Values in the Area
Average Home Value in this Area
Purchase History
| Date | Buyer | Sale Price | Title Company |
|---|---|---|---|
| Hudson Amanda | -- | -- | |
| Hudson Quincy | -- | -- | |
| Hudson Quincy | -- | -- | |
| Hudson Quincy | $307,000 | -- | |
| Nicholnott Inc | $275,500 | -- |
Source: Public Records
Mortgage History
| Date | Status | Borrower | Loan Amount |
|---|---|---|---|
| Open | Hudson Amanda | $435,000 | |
| Previous Owner | Hudson Quincy | $245,600 |
Source: Public Records
Tax History Compared to Growth
Tax History
| Year | Tax Paid | Tax Assessment Tax Assessment Total Assessment is a certain percentage of the fair market value that is determined by local assessors to be the total taxable value of land and additions on the property. | Land | Improvement |
|---|---|---|---|---|
| 2024 | $2,726 | $225,240 | $45,600 | $179,640 |
| 2023 | $2,726 | $213,960 | $45,600 | $168,360 |
| 2022 | $5,796 | $186,480 | $40,400 | $146,080 |
| 2021 | $4,982 | $143,400 | $29,600 | $113,800 |
| 2020 | $5,016 | $143,400 | $29,600 | $113,800 |
| 2019 | $4,647 | $133,880 | $29,600 | $104,280 |
| 2018 | $4,655 | $133,880 | $29,600 | $104,280 |
| 2016 | $4,530 | $127,240 | $25,200 | $102,040 |
| 2015 | $4,380 | $119,680 | $25,200 | $94,480 |
| 2014 | $3,735 | $100,960 | $19,200 | $81,760 |
Source: Public Records
Map
Nearby Homes
- 1547 Trilogy Park Dr
- 1331 Ashbury Park Dr
- 1351 Ashbury Park Dr NE
- 5171 Woodline
- 4850 Boulder Stone Way
- 1351 Ashbury Park Way E
- 4452 Orchard Grove Dr
- 1491 Torrington Dr
- 5747 Wheeler Rd
- 4362 Orchard Grove Dr
- 5599 Wheeler Ridge Rd
- 5689 Wheeler Ridge Rd
- 1431 Torrington Dr
- 1535 Moriah Trace
- 4759 Highland Point Dr
- 5130 Woodline View Cir
- 4881 Bill Cheek Rd
- 1431 Winding Ridge Trail
- 4727 Ardmore Ln
- 2030 Havenhurst Way
- 5078 Stone Moss Way
- 5058 Stone Moss Way
- 5048 Stone Moss Way
- 1604 Trilogy Park Dr
- 1604 Trilogy Park Dr
- 1604 Trilogy Park Dr Unit .EMPTY
- 1604 Trilogy Park Dr
- 1544 Trilogy Park Dr
- 1574 Trilogy Park Dr
- 5088 Stone Moss Way
- 1614 Trilogy Park Dr
- 1594 Trilogy Park Dr
- 0 Stone Moss Way
- 5071 Stone Moss Way Unit 2B
- 5051 Stone Moss Way Unit 2B
- 5028 Stone Moss Way
- 5081 Stone Moss Way Unit 1
- 1624 Trilogy Park Dr
- 5031 Stone Moss Way Unit 2B
- 5066 Trilogy Ln Unit 5