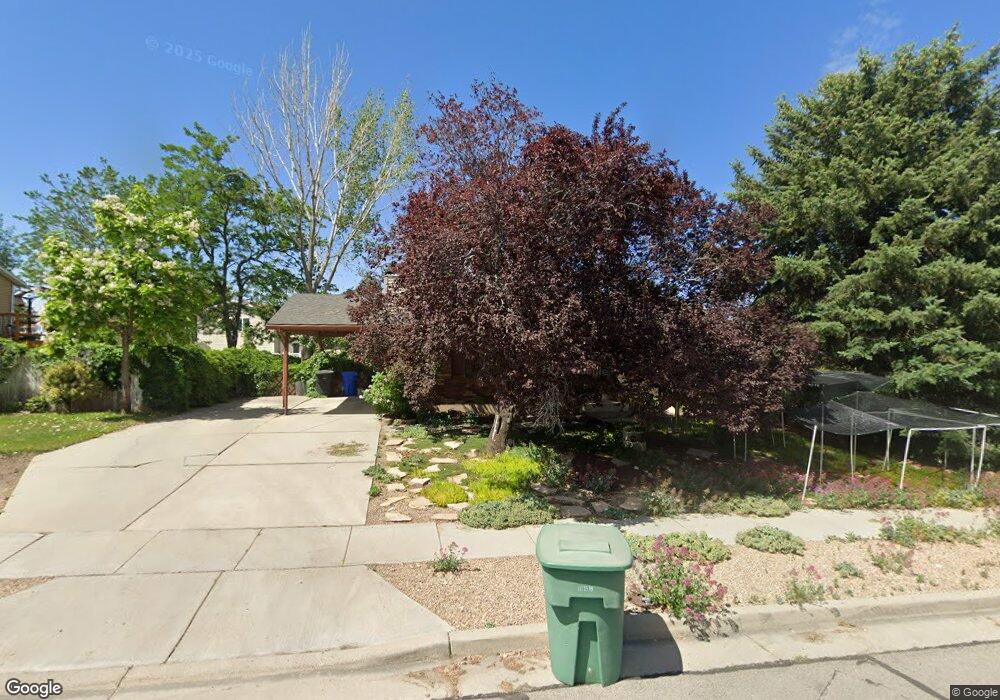
5068 W 6435 S West Jordan, UT 84081
Oquirrh NeighborhoodEstimated Value: $429,664 - $474,000
4
Beds
2
Baths
1,756
Sq Ft
$255/Sq Ft
Est. Value
About This Home
This home is located at 5068 W 6435 S, West Jordan, UT 84081 and is currently estimated at $448,416, approximately $255 per square foot. 5068 W 6435 S is a home located in Salt Lake County with nearby schools including Jim Bridger Elementary School, Thomas Jefferson Jr High School, and Kearns High School.
Ownership History
Date
Name
Owned For
Owner Type
Purchase Details
Closed on
Jun 19, 2020
Sold by
Flanders Jamie and Flanders Cody
Bought by
Flanders Jamie and Flanders Cody
Current Estimated Value
Home Financials for this Owner
Home Financials are based on the most recent Mortgage that was taken out on this home.
Original Mortgage
$149,000
Outstanding Balance
$104,746
Interest Rate
3.2%
Mortgage Type
New Conventional
Estimated Equity
$343,670
Purchase Details
Closed on
Aug 10, 2009
Sold by
Hickman Kevin Andrew and Morrill Rachel A
Bought by
Flanders Jamie and Flanders Cody
Home Financials for this Owner
Home Financials are based on the most recent Mortgage that was taken out on this home.
Original Mortgage
$177,650
Interest Rate
5.17%
Mortgage Type
VA
Purchase Details
Closed on
Aug 30, 2005
Sold by
Curtis Devirl W
Bought by
Hickman Kevin Andrew and Morrill Rachel A
Home Financials for this Owner
Home Financials are based on the most recent Mortgage that was taken out on this home.
Original Mortgage
$142,759
Interest Rate
5.64%
Mortgage Type
FHA
Purchase Details
Closed on
Oct 24, 1994
Sold by
Curtis Mitzi D
Bought by
Curtis Devirl W
Purchase Details
Closed on
Apr 25, 1994
Sold by
Curtis Devirl W
Bought by
Curtis Devirl W and Curtis Mitzi D
Create a Home Valuation Report for This Property
The Home Valuation Report is an in-depth analysis detailing your home's value as well as a comparison with similar homes in the area
Home Values in the Area
Average Home Value in this Area
Purchase History
| Date | Buyer | Sale Price | Title Company |
|---|---|---|---|
| Flanders Jamie | -- | Meridian Title | |
| Flanders Jamie | -- | United Title Services | |
| Hickman Kevin Andrew | -- | Landmark Title | |
| Curtis Devirl W | -- | -- | |
| Curtis Devirl W | -- | -- |
Source: Public Records
Mortgage History
| Date | Status | Borrower | Loan Amount |
|---|---|---|---|
| Open | Flanders Jamie | $149,000 | |
| Closed | Flanders Jamie | $177,650 | |
| Previous Owner | Hickman Kevin Andrew | $142,759 |
Source: Public Records
Tax History Compared to Growth
Tax History
| Year | Tax Paid | Tax Assessment Tax Assessment Total Assessment is a certain percentage of the fair market value that is determined by local assessors to be the total taxable value of land and additions on the property. | Land | Improvement |
|---|---|---|---|---|
| 2025 | $2,502 | $413,600 | $121,000 | $292,600 |
| 2024 | $2,502 | $394,500 | $114,100 | $280,400 |
| 2023 | $2,469 | $370,700 | $109,700 | $261,000 |
| 2022 | $2,442 | $373,000 | $107,600 | $265,400 |
| 2021 | $2,236 | $303,500 | $82,700 | $220,800 |
| 2020 | $2,050 | $263,000 | $82,700 | $180,300 |
| 2019 | $2,014 | $251,000 | $78,100 | $172,900 |
| 2018 | $1,917 | $230,700 | $78,100 | $152,600 |
| 2017 | $1,562 | $197,900 | $78,100 | $119,800 |
| 2016 | $1,442 | $181,400 | $78,100 | $103,300 |
| 2015 | $1,406 | $164,600 | $74,800 | $89,800 |
| 2014 | $1,379 | $158,400 | $72,400 | $86,000 |
Source: Public Records
Map
Nearby Homes
- 6398 S Lobelia Dr
- 6437 S Lobelia Dr
- 6568 S 5180 W
- 6635 S Milfoil Cir
- 4909 Sakura Ct
- 5183 W Cadenza Dr
- 6706 Marshrock Rd
- 6157 S Impressions Dr
- 6489 S Daffodil Way
- 5071 W Jarrad Rd
- 5352 Cassatt Cir
- 5382 W Northlilac Ave
- 5281 Saguaro Dr
- 4983 Shooting Star Ave
- 6022 S Park Wood Dr W
- 5275 Ridge Flower Way
- 5285 Ridge Flower Way
- 6160 S Miramonte Way Unit T-30
- 4790 W Barletta Ct
- 4692 W Talavera Way
- 5056 W 6435 S
- 5080 W 6435 S
- 5073 Fuchsia Dr
- 5065 Fuchsia Dr
- 5083 Fuchsia Dr
- 5069 W 6435 S
- 5092 W 6435 S
- 5083 W Fuchsia Dr
- 5075 W 6435 S
- 5061 W 6435 S
- 5042 W 6435 S
- 6408 S Lobelia Dr
- 5083 W 6435 S
- 5053 W 6435 S
- 6387 Fuchsia Dr
- 5093 W Fuchsia Dr
- 6408 Lobelia Dr
- 5041 W 6435 S
- 5093 Fuchsia Dr
- 6398 Lobelia Dr