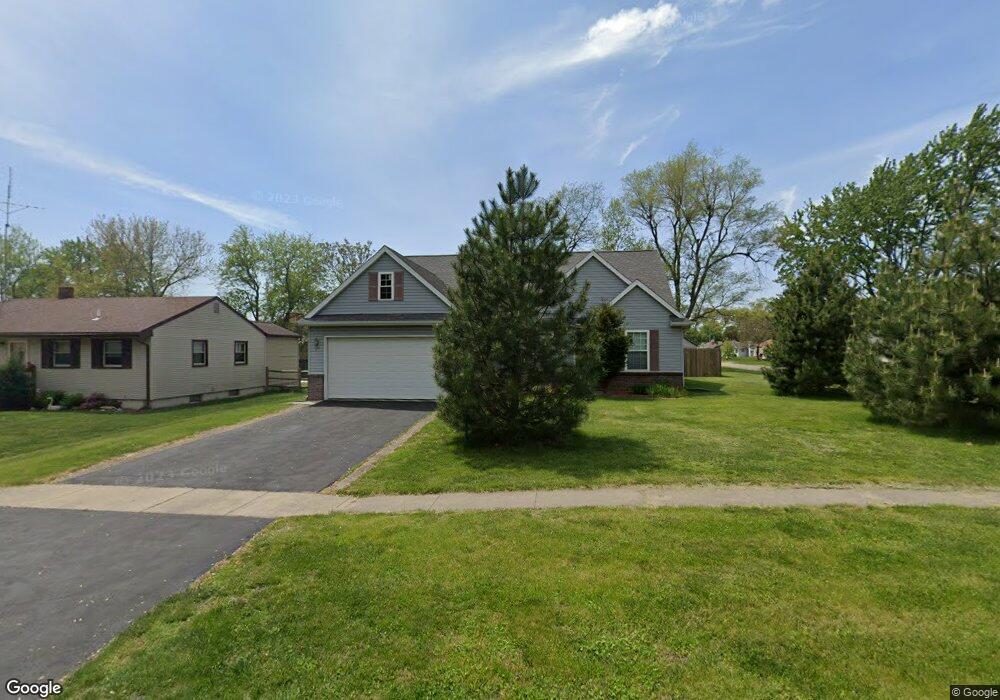
5069 Goodwill Rd Toledo, OH 43613
Whitmer-Trilby NeighborhoodEstimated Value: $195,000 - $229,641
3
Beds
2
Baths
1,440
Sq Ft
$151/Sq Ft
Est. Value
About This Home
This home is located at 5069 Goodwill Rd, Toledo, OH 43613 and is currently estimated at $217,160, approximately $150 per square foot. 5069 Goodwill Rd is a home located in Lucas County with nearby schools including Hiawatha Elementary School, Jefferson Junior High School, and Washington Junior High School.
Ownership History
Date
Name
Owned For
Owner Type
Purchase Details
Closed on
Mar 18, 2009
Sold by
Cabaj Carl M
Bought by
Cabaj Carl M and Cabaj Linda J
Current Estimated Value
Purchase Details
Closed on
Dec 8, 2008
Sold by
Indymac Federal Bank Fsb
Bought by
Cabaj Carl M
Home Financials for this Owner
Home Financials are based on the most recent Mortgage that was taken out on this home.
Original Mortgage
$91,200
Outstanding Balance
$60,574
Interest Rate
6.49%
Mortgage Type
Purchase Money Mortgage
Estimated Equity
$156,586
Purchase Details
Closed on
Sep 24, 2008
Sold by
Baldwin Staci
Bought by
Indymac Bank Fsb
Purchase Details
Closed on
Sep 19, 2005
Sold by
Smb Construction Co Inc
Bought by
Baldwin James L and Baldwin Staci
Home Financials for this Owner
Home Financials are based on the most recent Mortgage that was taken out on this home.
Original Mortgage
$175,100
Interest Rate
8.25%
Mortgage Type
Fannie Mae Freddie Mac
Purchase Details
Closed on
Dec 14, 1993
Create a Home Valuation Report for This Property
The Home Valuation Report is an in-depth analysis detailing your home's value as well as a comparison with similar homes in the area
Home Values in the Area
Average Home Value in this Area
Purchase History
| Date | Buyer | Sale Price | Title Company |
|---|---|---|---|
| Cabaj Carl M | -- | None Available | |
| Cabaj Carl M | $114,000 | Oldstone Title Agency | |
| Indymac Federal Bank Fsb | -- | Oldstone Title Agency | |
| Indymac Bank Fsb | $90,000 | None Available | |
| Baldwin James L | $175,100 | -- | |
| -- | -- | -- |
Source: Public Records
Mortgage History
| Date | Status | Borrower | Loan Amount |
|---|---|---|---|
| Open | Cabaj Carl M | $91,200 | |
| Previous Owner | Baldwin James L | $175,100 |
Source: Public Records
Tax History
| Year | Tax Paid | Tax Assessment Tax Assessment Total Assessment is a certain percentage of the fair market value that is determined by local assessors to be the total taxable value of land and additions on the property. | Land | Improvement |
|---|---|---|---|---|
| 2025 | -- | $72,555 | $8,540 | $64,015 |
| 2024 | $2,027 | $72,555 | $8,540 | $64,015 |
| 2023 | $2,991 | $47,145 | $7,700 | $39,445 |
| 2022 | $2,984 | $47,145 | $7,700 | $39,445 |
| 2021 | $3,046 | $47,145 | $7,700 | $39,445 |
| 2020 | $2,897 | $39,235 | $6,405 | $32,830 |
| 2019 | $2,784 | $39,235 | $6,405 | $32,830 |
| 2018 | $2,531 | $39,235 | $6,405 | $32,830 |
| 2017 | $2,228 | $33,250 | $5,425 | $27,825 |
| 2016 | $2,264 | $95,000 | $15,500 | $79,500 |
| 2015 | $2,298 | $95,000 | $15,500 | $79,500 |
| 2014 | $1,670 | $33,260 | $5,430 | $27,830 |
| 2013 | $1,670 | $33,260 | $5,430 | $27,830 |
Source: Public Records
Map
Nearby Homes
- 2849 W Laskey Rd
- 2820 Eldora Dr
- 2645 Boxwood Rd
- 5111 Elaine Dr
- 4932 Bales Rd
- 4914 Bales Rd
- 2834 Wyndale Rd
- 5211 Douglas Rd
- 4924 Roywood Rd
- 4807 Brott Rd
- 4726 Bowen Rd
- 2433 Paradise Ave
- 4722 Bowser Dr
- 5322 Douglas Rd
- 2846 Elsie Ave
- 5420 Ruth Ave
- 2842 Oak Grove Place
- 5125 Selma St
- 5103 Fairgreen Dr
- 5143 Fairgreen Dr
- 5061 Goodwill Rd
- 2801 Piddock Rd
- 5055 Goodwill Rd
- 2758 Piddock Rd
- 5066 Breezeway Dr Unit 18
- 5064 Breezeway Dr Unit 17
- 2754 Piddock Rd
- 2764 Piddock Rd
- 2748 Piddock Rd
- 5072 Goodwill Rd
- 2804 Piddock Rd
- 5066 Goodwill Rd
- 2744 Piddock Rd
- 5070 Breezeway Dr Unit 20
- 5068 Breezeway Dr Unit 19
- 2810 Piddock Rd
- 2738 Piddock Rd
- 2813 Piddock Rd
- 5054 Goodwill Rd
- 5072 Breezeway Dr Unit 21
Your Personal Tour Guide
Ask me questions while you tour the home.