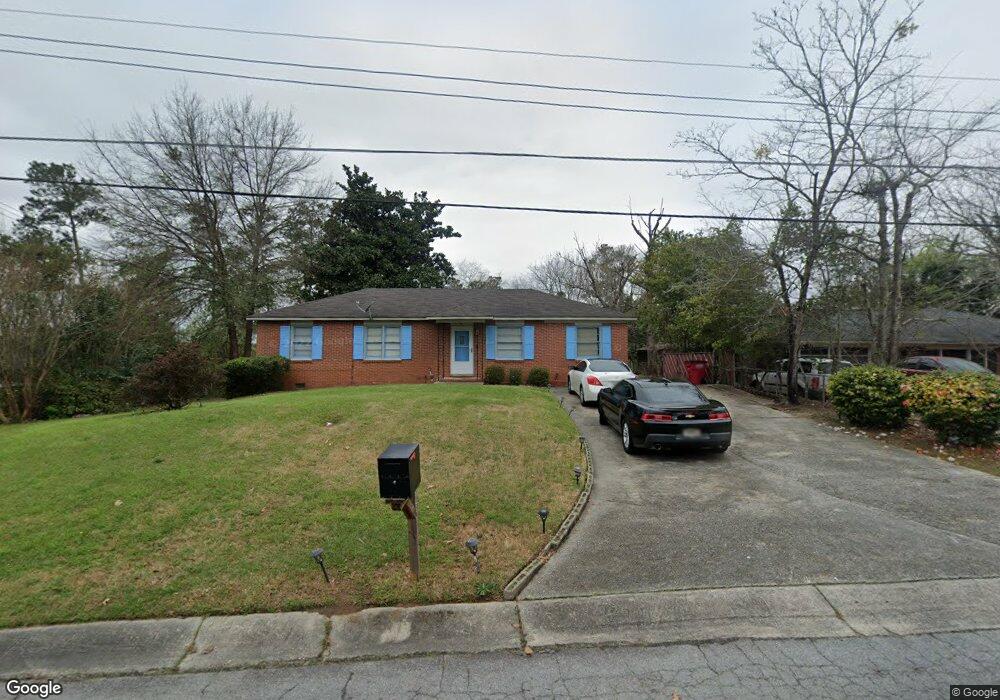
5069 Pinefield Dr Macon, GA 31206
Estimated Value: $111,000 - $169,375
3
Beds
3
Baths
1,800
Sq Ft
$79/Sq Ft
Est. Value
About This Home
This home is located at 5069 Pinefield Dr, Macon, GA 31206 and is currently estimated at $141,844, approximately $78 per square foot. 5069 Pinefield Dr is a home located in Bibb County with nearby schools including Veterans Elementary School, Southwest High School, and Gilead Christian Academy.
Ownership History
Date
Name
Owned For
Owner Type
Purchase Details
Closed on
Jul 23, 2007
Sold by
Rac Closing Services Llc
Bought by
Harris John W and Harris Delphene
Current Estimated Value
Home Financials for this Owner
Home Financials are based on the most recent Mortgage that was taken out on this home.
Original Mortgage
$91,648
Interest Rate
6.65%
Mortgage Type
VA
Purchase Details
Closed on
Mar 14, 2007
Sold by
Blount Christopher A
Bought by
Rac Closing Services Llc
Purchase Details
Closed on
Jun 20, 2005
Sold by
Maloy Johnny J and Maloy Carolyn M
Bought by
Blount Christopher A
Home Financials for this Owner
Home Financials are based on the most recent Mortgage that was taken out on this home.
Original Mortgage
$78,000
Interest Rate
5.7%
Mortgage Type
New Conventional
Create a Home Valuation Report for This Property
The Home Valuation Report is an in-depth analysis detailing your home's value as well as a comparison with similar homes in the area
Home Values in the Area
Average Home Value in this Area
Purchase History
| Date | Buyer | Sale Price | Title Company |
|---|---|---|---|
| Harris John W | $89,500 | None Available | |
| Rac Closing Services Llc | $90,000 | None Available | |
| Blount Christopher A | $78,000 | None Avilabale |
Source: Public Records
Mortgage History
| Date | Status | Borrower | Loan Amount |
|---|---|---|---|
| Previous Owner | Harris John W | $91,648 | |
| Previous Owner | Blount Christopher A | $78,000 |
Source: Public Records
Tax History Compared to Growth
Tax History
| Year | Tax Paid | Tax Assessment Tax Assessment Total Assessment is a certain percentage of the fair market value that is determined by local assessors to be the total taxable value of land and additions on the property. | Land | Improvement |
|---|---|---|---|---|
| 2025 | $946 | $45,503 | $2,350 | $43,153 |
| 2024 | $978 | $45,503 | $2,350 | $43,153 |
| 2023 | $521 | $45,503 | $2,350 | $43,153 |
| 2022 | $1,015 | $36,330 | $4,878 | $31,452 |
| 2021 | $1,115 | $36,330 | $4,878 | $31,452 |
| 2020 | $1,139 | $36,330 | $4,878 | $31,452 |
| 2019 | $1,148 | $36,330 | $4,878 | $31,452 |
| 2018 | $1,938 | $36,330 | $4,878 | $31,452 |
| 2017 | $1,099 | $36,330 | $4,878 | $31,452 |
| 2016 | $1,015 | $36,330 | $4,878 | $31,452 |
| 2015 | $1,422 | $36,022 | $4,878 | $31,144 |
| 2014 | $1,686 | $36,022 | $4,878 | $31,144 |
Source: Public Records
Map
Nearby Homes
- 5060 Pinefield Dr
- 4940 Pinefield Dr
- 3913 Blair Ct
- 3842 Wynnwood Dr
- 4500 Chambers Rd
- 3716 Wynnwood Dr
- 2868 Barrett Ave
- 2765 Alden St
- 4742 Bloomfield Rd
- 2995 Virginia Dr
- 140 Spencer Hill Ct
- 2770 Bonnie Ave
- 2769 Nancy Dr
- 2972 Richard Dr
- 2768 Nancy Dr
- 3078 Alfred Dr
- 165 Camden Trace
- 189 Camden Trace
- 120 Camden Trace
- 124 Camden Trace
- 5077 Pinefield Dr
- 5061 Pinefield Dr
- 5085 Pinefield Dr
- 5010 Williamson Rd
- 5049 Pinefield Dr
- 5012 Nisbet Dr
- 5068 Pinefield Dr
- 5020 Nisbet Dr
- 5093 Pinefield Dr
- 5076 Pinefield Dr Unit 400-A11
- 5076 Pinefield Dr
- 5076 Pinefield Dr Unit A11
- 5004 Nisbet Dr
- 5084 Pinefield Dr
- 5028 Nisbet Dr
- 5052 Pinefield Dr
- 5103 Pinefield Dr
- 5092 Pinefield Dr
- 5036 Nisbet Dr
- 5044 Pinefield Dr