Estimated Value: $395,000 - $427,000
3
Beds
2
Baths
1,188
Sq Ft
$344/Sq Ft
Est. Value
About This Home
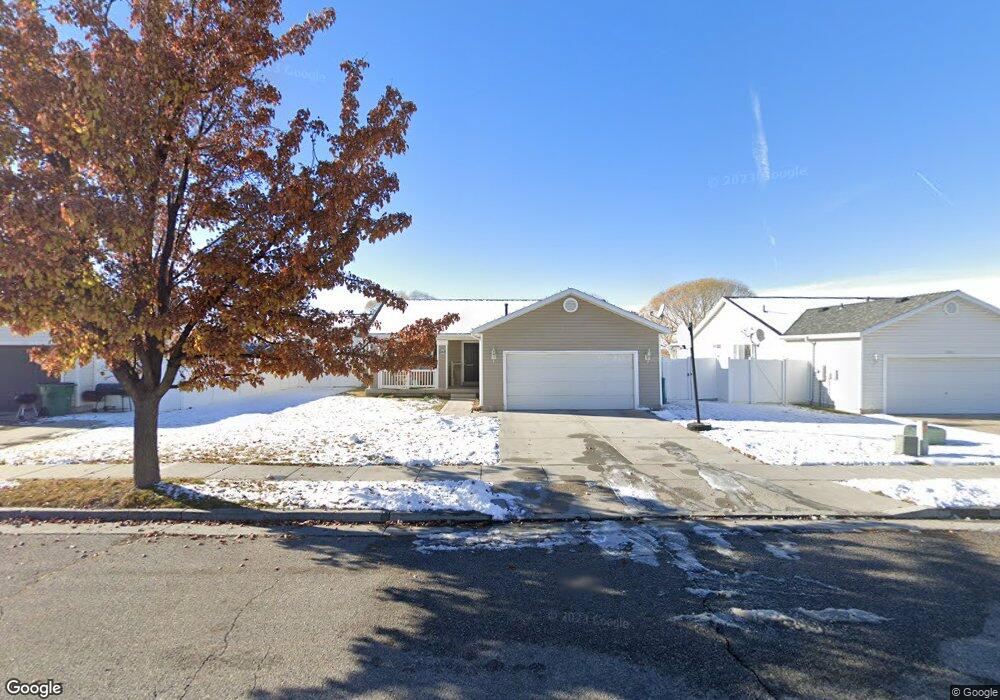
This home is located at 5069 S 3925 W, Roy, UT 84067 and is currently estimated at $408,216, approximately $343 per square foot. 5069 S 3925 W is a home located in Weber County with nearby schools including Country View School, Rocky Mountain Junior High School, and Roy High School.
Ownership History
Date
Name
Owned For
Owner Type
Purchase Details
Closed on
Apr 20, 2009
Sold by
Jordan Martin D and Jordan Doris K
Bought by
Gibson Kasey J and Gibson Amanda J
Current Estimated Value
Home Financials for this Owner
Home Financials are based on the most recent Mortgage that was taken out on this home.
Original Mortgage
$134,000
Outstanding Balance
$85,073
Interest Rate
5.02%
Mortgage Type
Purchase Money Mortgage
Estimated Equity
$323,143
Purchase Details
Closed on
Jun 18, 2001
Sold by
Jordan Martin D and Jordan Doris K
Bought by
Jordan Martin D and Jordan Doris K
Purchase Details
Closed on
May 27, 1999
Sold by
Cameridge Homes Llc
Bought by
Jordan Martin D and Jordan Doris K
Home Financials for this Owner
Home Financials are based on the most recent Mortgage that was taken out on this home.
Original Mortgage
$97,200
Interest Rate
6.86%
Create a Home Valuation Report for This Property
The Home Valuation Report is an in-depth analysis detailing your home's value as well as a comparison with similar homes in the area
Home Values in the Area
Average Home Value in this Area
Purchase History
| Date | Buyer | Sale Price | Title Company |
|---|---|---|---|
| Gibson Kasey J | -- | First American Legend Hills | |
| Jordan Martin D | -- | -- | |
| Jordan Martin D | -- | Merrill Title |
Source: Public Records
Mortgage History
| Date | Status | Borrower | Loan Amount |
|---|---|---|---|
| Open | Gibson Kasey J | $134,000 | |
| Previous Owner | Jordan Martin D | $97,200 |
Source: Public Records
Tax History Compared to Growth
Tax History
| Year | Tax Paid | Tax Assessment Tax Assessment Total Assessment is a certain percentage of the fair market value that is determined by local assessors to be the total taxable value of land and additions on the property. | Land | Improvement |
|---|---|---|---|---|
| 2025 | $2,513 | $396,446 | $125,007 | $271,439 |
| 2024 | $2,431 | $212,299 | $68,753 | $143,546 |
| 2023 | $2,425 | $212,850 | $65,864 | $146,986 |
| 2022 | $2,468 | $223,300 | $57,758 | $165,542 |
| 2021 | $1,937 | $286,000 | $79,963 | $206,037 |
| 2020 | $1,901 | $259,000 | $79,963 | $179,037 |
| 2019 | $1,792 | $229,000 | $44,976 | $184,024 |
| 2018 | $1,707 | $205,000 | $42,041 | $162,959 |
| 2017 | $1,572 | $176,000 | $42,041 | $133,959 |
| 2016 | $1,531 | $92,228 | $21,944 | $70,284 |
| 2015 | $1,350 | $82,408 | $21,944 | $60,464 |
| 2014 | $1,243 | $74,096 | $19,237 | $54,859 |
Source: Public Records
Map
Nearby Homes
- 5235 Midland Dr
- 4021 W 5000 S
- 4990 S 4075 W
- 3820 Foxglen Dr
- 4890 S 4075 W
- 3766 W 5300 S
- 4218 W 5050 S
- 5270 S 4200 W
- 5013 S 4150 W
- 4141 W 4875 S
- 4106 W 4875 S
- 5116 S 4300 W
- 5465 S 4050 W
- Poplar Plan at Highgate Cove
- Pando Plan at Highgate Cove
- 4097 W 4750 S
- 3607 W 5400 S
- 4094 W 4700 S
- 3523 W 4835 S Unit 28
- 3524 W 4835 S Unit 22