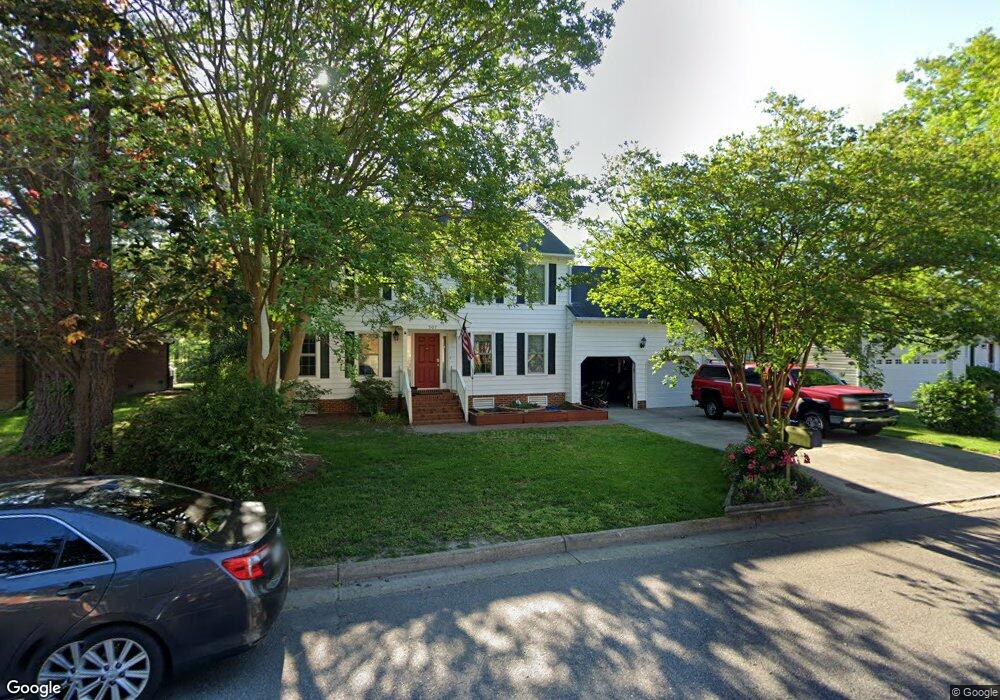
507 Aguila Ct Chesapeake, VA 23322
Great Bridge NeighborhoodEstimated Value: $566,494 - $600,000
4
Beds
3
Baths
2,679
Sq Ft
$217/Sq Ft
Est. Value
About This Home
This home is located at 507 Aguila Ct, Chesapeake, VA 23322 and is currently estimated at $581,124, approximately $216 per square foot. 507 Aguila Ct is a home located in Chesapeake City with nearby schools including Cedar Road Elementary School, Great Bridge Middle School, and Grassfield High School.
Ownership History
Date
Name
Owned For
Owner Type
Purchase Details
Closed on
Aug 22, 2020
Sold by
Hoch Shawn Alexander and Morrow Jaclyn Michele
Bought by
Hoch Shawn Alexander and Hoch Jaclyn Michele
Current Estimated Value
Purchase Details
Closed on
Oct 5, 2010
Sold by
Tedesso Thomas W
Bought by
Hoch Shawn A and Morrow Jaclyn M
Home Financials for this Owner
Home Financials are based on the most recent Mortgage that was taken out on this home.
Original Mortgage
$366,207
Outstanding Balance
$242,149
Interest Rate
4.39%
Mortgage Type
VA
Estimated Equity
$338,975
Purchase Details
Closed on
Jun 24, 2002
Sold by
Stringberg Steven S
Bought by
Tedesso Thomas W
Home Financials for this Owner
Home Financials are based on the most recent Mortgage that was taken out on this home.
Original Mortgage
$204,210
Interest Rate
6.57%
Create a Home Valuation Report for This Property
The Home Valuation Report is an in-depth analysis detailing your home's value as well as a comparison with similar homes in the area
Home Values in the Area
Average Home Value in this Area
Purchase History
| Date | Buyer | Sale Price | Title Company |
|---|---|---|---|
| Hoch Shawn Alexander | -- | None Available | |
| Hoch Shawn A | $358,500 | -- | |
| Tedesso Thomas W | $227,000 | -- |
Source: Public Records
Mortgage History
| Date | Status | Borrower | Loan Amount |
|---|---|---|---|
| Open | Hoch Shawn A | $366,207 | |
| Previous Owner | Tedesso Thomas W | $204,210 |
Source: Public Records
Tax History Compared to Growth
Tax History
| Year | Tax Paid | Tax Assessment Tax Assessment Total Assessment is a certain percentage of the fair market value that is determined by local assessors to be the total taxable value of land and additions on the property. | Land | Improvement |
|---|---|---|---|---|
| 2025 | $4,872 | $504,800 | $205,000 | $299,800 |
| 2024 | $4,872 | $482,400 | $185,000 | $297,400 |
| 2023 | $4,168 | $463,200 | $165,000 | $298,200 |
| 2022 | $4,106 | $406,500 | $145,000 | $261,500 |
| 2021 | $3,781 | $360,100 | $125,000 | $235,100 |
| 2020 | $3,662 | $348,800 | $125,000 | $223,800 |
| 2019 | $3,618 | $344,600 | $125,000 | $219,600 |
| 2018 | $3,618 | $344,600 | $125,000 | $219,600 |
| 2017 | $3,366 | $320,600 | $120,000 | $200,600 |
| 2016 | $3,366 | $320,600 | $120,000 | $200,600 |
| 2015 | $3,340 | $318,100 | $120,000 | $198,100 |
| 2014 | $3,280 | $312,400 | $120,000 | $192,400 |
Source: Public Records
Map
Nearby Homes
- 724 Brisa Ct
- 1332 Club House Dr
- 504 Landmark Ct
- 1141 Eagle Pointe Way
- 501 Landmark Ct
- 902 Summerfield Crescent
- 406 Whisper Walk
- 424 Galies Pointe Ln
- 303 Sherwood Forest Rd
- 510 San Pedro Dr
- 405 Beacon Key Ct
- 328 San Roman Dr
- 1312 False Creek Way
- 1801 Honey Milk Rd
- 1815 Honey Milk Rd
- 1821 Honey Milk Rd
- 1827 Honey Milk Rd
- 1837 Honey Milk Rd
- 1849 Honey Milk Rd
- 1000 Fox Ridge Ct