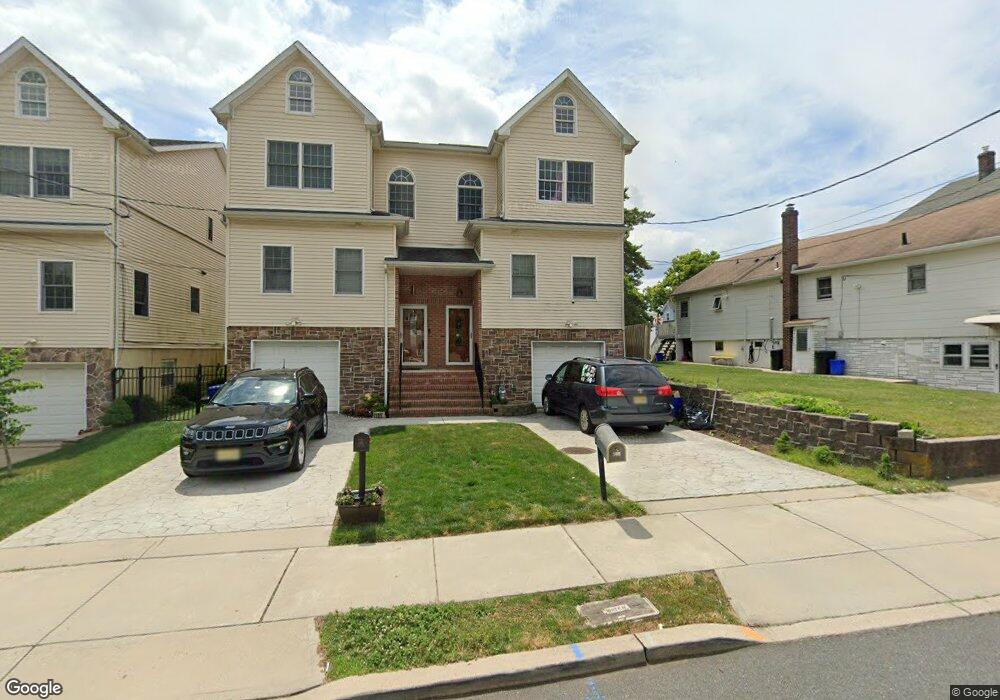
507 Augusta St South Amboy, NJ 08879
Estimated Value: $283,000 - $560,856
2
Beds
4
Baths
2,193
Sq Ft
$206/Sq Ft
Est. Value
About This Home
This home is located at 507 Augusta St, South Amboy, NJ 08879 and is currently estimated at $451,214, approximately $205 per square foot. 507 Augusta St is a home located in Middlesex County with nearby schools including South Amboy Elementary School, South Amboy Middle/High School, and St. Mary Elementary School.
Ownership History
Date
Name
Owned For
Owner Type
Purchase Details
Closed on
Jun 1, 2022
Sold by
Mckenzie Wood Alfred Russell and Mckenzie Eli Celia
Bought by
Network Rentals Llc
Current Estimated Value
Home Financials for this Owner
Home Financials are based on the most recent Mortgage that was taken out on this home.
Original Mortgage
$205,000
Interest Rate
4.31%
Mortgage Type
Construction
Purchase Details
Closed on
Apr 30, 2015
Sold by
Ab Realty Llc
Bought by
Wood Alfred R M and Srael,Celia Elisa
Purchase Details
Closed on
Oct 29, 2012
Sold by
Oxbridge Real Estate Llc Co
Bought by
Ab Realty Llc Co
Purchase Details
Closed on
Dec 11, 2006
Sold by
The Kelly Organization Llc
Bought by
Oxbridge Real Estate Llc
Create a Home Valuation Report for This Property
The Home Valuation Report is an in-depth analysis detailing your home's value as well as a comparison with similar homes in the area
Home Values in the Area
Average Home Value in this Area
Purchase History
| Date | Buyer | Sale Price | Title Company |
|---|---|---|---|
| Network Rentals Llc | $200,000 | None Listed On Document | |
| Wood Alfred R M | $218,000 | -- | |
| Ab Realty Llc Co | -- | None Available | |
| Oxbridge Real Estate Llc | $560,000 | -- |
Source: Public Records
Mortgage History
| Date | Status | Borrower | Loan Amount |
|---|---|---|---|
| Closed | Network Rentals Llc | $205,000 |
Source: Public Records
Tax History Compared to Growth
Tax History
| Year | Tax Paid | Tax Assessment Tax Assessment Total Assessment is a certain percentage of the fair market value that is determined by local assessors to be the total taxable value of land and additions on the property. | Land | Improvement |
|---|---|---|---|---|
| 2025 | $7,381 | $230,000 | $112,500 | $117,500 |
| 2024 | $7,102 | $230,000 | $112,500 | $117,500 |
| 2023 | $7,102 | $230,000 | $112,500 | $117,500 |
| 2022 | $6,748 | $230,000 | $112,500 | $117,500 |
| 2021 | $6,610 | $230,000 | $112,500 | $117,500 |
| 2020 | $6,479 | $230,000 | $112,500 | $117,500 |
| 2019 | $6,376 | $230,000 | $112,500 | $117,500 |
| 2018 | $6,323 | $230,000 | $112,500 | $117,500 |
| 2017 | $6,222 | $230,000 | $112,500 | $117,500 |
| 2016 | $6,065 | $230,000 | $112,500 | $117,500 |
| 2015 | $6,109 | $230,000 | $112,500 | $117,500 |
| 2014 | $6,867 | $267,700 | $112,500 | $155,200 |
Source: Public Records
Map
Nearby Homes