Estimated Value: $421,129 - $473,000
4
Beds
3
Baths
2,527
Sq Ft
$177/Sq Ft
Est. Value
About This Home
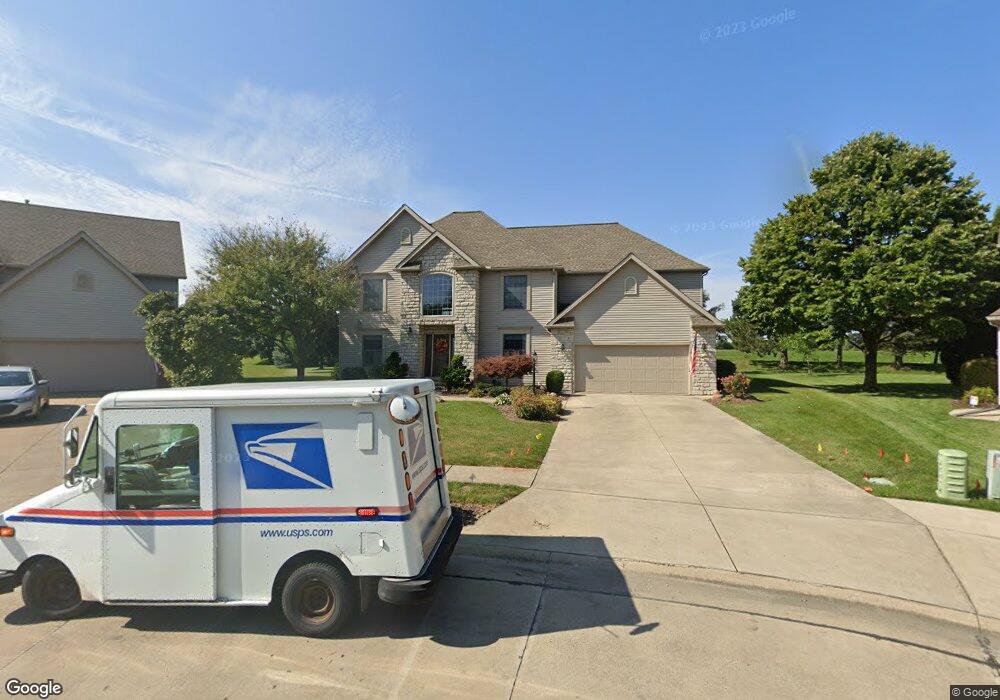
This home is located at 507 Berkshire Ct, Huron, OH 44839 and is currently estimated at $447,282, approximately $177 per square foot. 507 Berkshire Ct is a home located in Erie County with nearby schools including Woodlands Intermediate School, Shawnee Elementary School, and McCormick Junior High School.
Ownership History
Date
Name
Owned For
Owner Type
Purchase Details
Closed on
May 31, 2006
Sold by
Boos Peter C and Boos Maridee S
Bought by
Magovac Michael T and Magovac Rhonda C
Current Estimated Value
Home Financials for this Owner
Home Financials are based on the most recent Mortgage that was taken out on this home.
Original Mortgage
$90,000
Outstanding Balance
$53,238
Interest Rate
6.68%
Mortgage Type
Future Advance Clause Open End Mortgage
Estimated Equity
$394,044
Purchase Details
Closed on
Jun 14, 2000
Sold by
Linden Douglas B
Bought by
Boos Peter C and Boos Maridee S
Home Financials for this Owner
Home Financials are based on the most recent Mortgage that was taken out on this home.
Original Mortgage
$220,000
Interest Rate
8.31%
Mortgage Type
New Conventional
Purchase Details
Closed on
Apr 4, 1995
Sold by
Westport Dev Ptns
Bought by
Linden Douglas B and Linden Jodi L
Create a Home Valuation Report for This Property
The Home Valuation Report is an in-depth analysis detailing your home's value as well as a comparison with similar homes in the area
Home Values in the Area
Average Home Value in this Area
Purchase History
| Date | Buyer | Sale Price | Title Company |
|---|---|---|---|
| Magovac Michael T | $262,000 | First American Title | |
| Boos Peter C | $258,900 | -- | |
| Linden Douglas B | $35,900 | -- |
Source: Public Records
Mortgage History
| Date | Status | Borrower | Loan Amount |
|---|---|---|---|
| Open | Magovac Michael T | $90,000 | |
| Previous Owner | Boos Peter C | $220,000 |
Source: Public Records
Tax History
| Year | Tax Paid | Tax Assessment Tax Assessment Total Assessment is a certain percentage of the fair market value that is determined by local assessors to be the total taxable value of land and additions on the property. | Land | Improvement |
|---|---|---|---|---|
| 2024 | $5,108 | $134,130 | $23,240 | $110,890 |
| 2023 | $5,254 | $94,836 | $20,566 | $74,270 |
| 2022 | $3,932 | $94,843 | $20,566 | $74,277 |
| 2021 | $3,921 | $94,850 | $20,570 | $74,280 |
| 2020 | $4,012 | $94,560 | $20,570 | $73,990 |
| 2019 | $4,189 | $94,560 | $20,570 | $73,990 |
| 2018 | $4,211 | $94,560 | $20,570 | $73,990 |
| 2017 | $3,915 | $85,450 | $20,150 | $65,300 |
| 2016 | $3,790 | $85,450 | $20,150 | $65,300 |
| 2015 | $3,786 | $85,450 | $20,150 | $65,300 |
| 2014 | $3,625 | $80,880 | $20,150 | $60,730 |
| 2013 | $3,573 | $80,880 | $20,150 | $60,730 |
Source: Public Records
Map
Nearby Homes
- 1 Cleveland Rd W
- 1361 Cleveland Rd W Unit C
- 0 Bucyrus Ave
- 807 Cleveland Rd W
- 721 Creekside Dr
- 706 Creekside Dr
- 11 Turtle Bay
- 201 Dayton Ave
- 525 Liberty Dr Unit A
- 2016 Cleveland Rd W
- 323 Portland Dr
- 919 Glenview Dr
- 535 Wilbor Ave
- 41 Poplar St
- 224 Atwood Place
- 220 Overlook Rd
- 0 W Cleveland Rd
- 41 Richland Ave
- 0 Bogart Rd
- 122 Atwood Place
- 509 Berkshire Ct
- 505 Berkshire Ct
- 508 Berkshire Ct
- 1307 Worthington Place
- 503 Berkshire Ct
- 1305 Worthington Place
- 47 Berkshire Ct
- 50 Berkshire Ct
- 506 Berkshire Ct
- 504 Berkshire Ct
- 1303 Worthington Place
- 501 Berkshire Ct
- 502 Berkshire Ct
- 1309 Worthington Place
- 1301 Worthington Place
- 57 Worthington Place
- 60 Worthington Place
- 59 Worthington Place
- 503 Westport Blvd
- 501 Westport Blvd
Your Personal Tour Guide
Ask me questions while you tour the home.