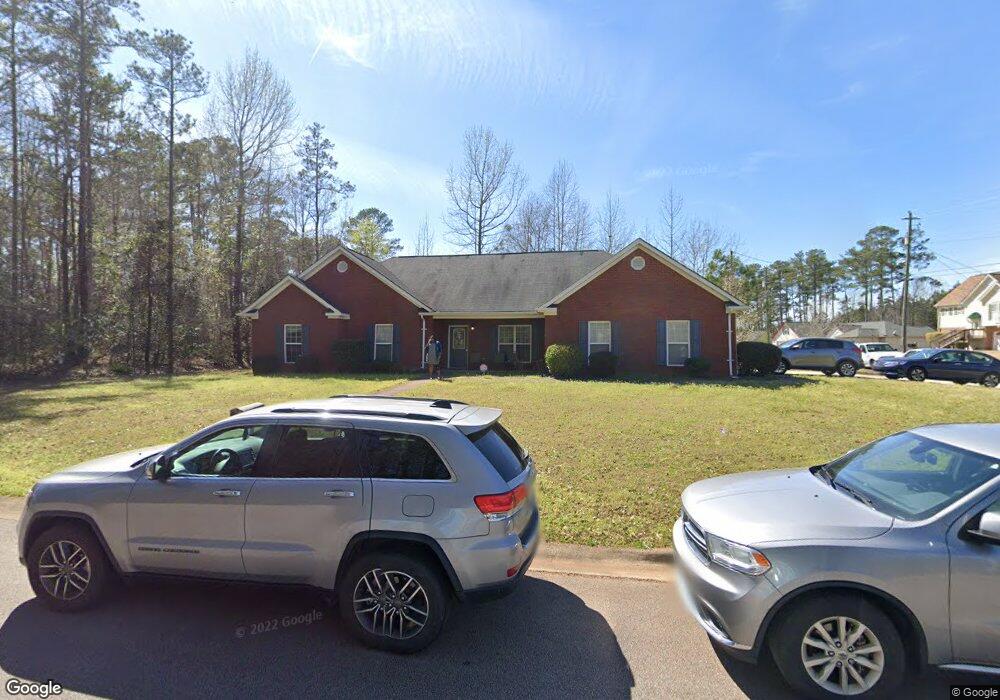
507 Camelot Dr Lagrange, GA 30241
Estimated Value: $262,000 - $297,000
4
Beds
2
Baths
1,932
Sq Ft
$143/Sq Ft
Est. Value
About This Home
This home is located at 507 Camelot Dr, Lagrange, GA 30241 and is currently estimated at $275,787, approximately $142 per square foot. 507 Camelot Dr is a home located in Troup County with nearby schools including Franklin Forest Elementary School, Hollis Hand Elementary School, and Ethel W. Kight Elementary School.
Ownership History
Date
Name
Owned For
Owner Type
Purchase Details
Closed on
Aug 10, 2016
Bought by
Thornton Stephanie Victoria
Current Estimated Value
Home Financials for this Owner
Home Financials are based on the most recent Mortgage that was taken out on this home.
Original Mortgage
$151,701
Outstanding Balance
$120,131
Interest Rate
3.5%
Mortgage Type
FHA
Estimated Equity
$155,656
Purchase Details
Closed on
Apr 5, 2016
Sold by
Taylor Shenisa
Bought by
Hutchinson Investments Llc
Purchase Details
Closed on
Jul 1, 2008
Sold by
Decoteau Oneil G
Bought by
Taylor Shenisa R
Home Financials for this Owner
Home Financials are based on the most recent Mortgage that was taken out on this home.
Original Mortgage
$174,265
Interest Rate
6.03%
Mortgage Type
FHA
Purchase Details
Closed on
Jan 26, 2004
Sold by
Starmount Enterprises Inc
Bought by
Oneil G Decoteau
Purchase Details
Closed on
Feb 15, 2001
Bought by
Starmount Enterprises Inc
Create a Home Valuation Report for This Property
The Home Valuation Report is an in-depth analysis detailing your home's value as well as a comparison with similar homes in the area
Purchase History
| Date | Buyer | Sale Price | Title Company |
|---|---|---|---|
| Thornton Stephanie Victoria | $154,500 | -- | |
| Hutchinson Investments Llc | $120,705 | -- | |
| Taylor Shenisa R | $177,000 | -- | |
| Oneil G Decoteau | $21,100 | -- | |
| Starmount Enterprises Inc | -- | -- |
Source: Public Records
Mortgage History
| Date | Status | Borrower | Loan Amount |
|---|---|---|---|
| Open | Thornton Stephanie Victoria | $151,701 | |
| Previous Owner | Taylor Shenisa R | $174,265 |
Source: Public Records
Tax History
| Year | Tax Paid | Tax Assessment Tax Assessment Total Assessment is a certain percentage of the fair market value that is determined by local assessors to be the total taxable value of land and additions on the property. | Land | Improvement |
|---|---|---|---|---|
| 2025 | $2,259 | $92,680 | $10,000 | $82,680 |
| 2024 | $2,259 | $84,800 | $10,000 | $74,800 |
| 2023 | $2,137 | $80,360 | $10,000 | $70,360 |
| 2022 | $2,077 | $76,400 | $10,000 | $66,400 |
| 2021 | $1,992 | $68,040 | $8,000 | $60,040 |
| 2020 | $1,992 | $68,040 | $8,000 | $60,040 |
| 2019 | $1,817 | $62,240 | $8,000 | $54,240 |
| 2018 | $1,817 | $62,240 | $8,000 | $54,240 |
| 2017 | $1,804 | $62,240 | $8,000 | $54,240 |
| 2016 | $1,727 | $57,270 | $8,000 | $49,270 |
| 2015 | $1,690 | $55,952 | $8,000 | $47,952 |
| 2014 | $1,617 | $53,428 | $8,000 | $45,428 |
| 2013 | -- | $56,323 | $8,000 | $48,323 |
Source: Public Records
Map
Nearby Homes
- 203 Bonaventure Dr
- 210 Hearthstone Dr
- 224 Rutland Cir
- 102 Dogwood Dr
- 202 Park Hill Dr
- 114 Briarcliff Rd
- 806 New Franklin Rd
- 134 S Page St
- 87 Youngs Mill Rd
- 706 N Harlem Cir
- 110 Lenox Cir
- 115 Clara Jean Ct
- 204 Colonial St
- 616 S Harlem Cir
- 110 Russell St
- 212 Cleveland Dr
- 900 North St
- 204 Cleveland Dr
- 107 N Barnard Ave
- 509 Youngs Mill Rd
- 303 Town Center Dr
- 505 Camelot Dr
- 300 Town Center Dr
- 305 Town Center Dr
- 302 Town Center Dr
- 503 Camelot Dr
- 504 Camelot Dr
- 504 Camelot Dr Unit 1
- 304 Town Center Dr
- 307 Town Center Dr
- 502 Camelot Dr
- 501 Camelot Dr
- 402 Somerset Place
- 306 Town Center Dr
- 400 Somerset Place
- 500 Camelot Dr
- 309 Town Center Dr
- 308 Town Center Dr
- 404 Somerset Place
- 412 Camelot Dr
Your Personal Tour Guide
Ask me questions while you tour the home.