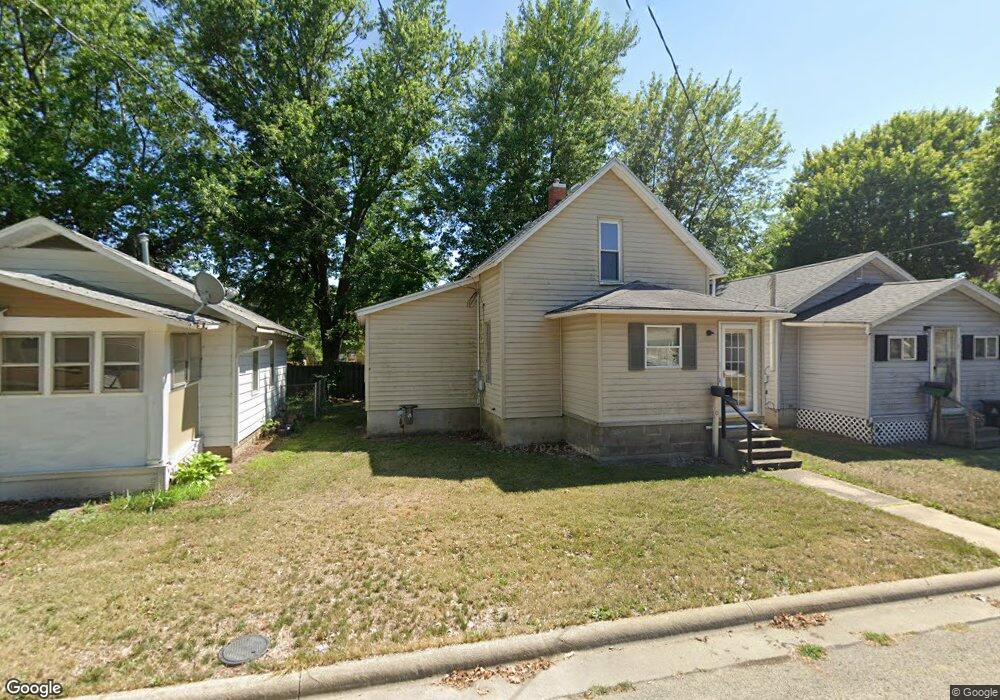
507 E 9th St Sterling, IL 61081
Estimated Value: $74,000 - $100,000
Studio
--
Bath
--
Sq Ft
3,964
Sq Ft Lot
About This Home
This home is located at 507 E 9th St, Sterling, IL 61081 and is currently estimated at $89,924. 507 E 9th St is a home located in Whiteside County with nearby schools including St. Mary's School.
Ownership History
Date
Name
Owned For
Owner Type
Purchase Details
Closed on
Oct 7, 2015
Sold by
Henson Mark L and Henson Mark
Bought by
Woosley Billy D
Current Estimated Value
Home Financials for this Owner
Home Financials are based on the most recent Mortgage that was taken out on this home.
Original Mortgage
$530,000
Interest Rate
4.75%
Mortgage Type
Purchase Money Mortgage
Purchase Details
Closed on
Jun 19, 2014
Sold by
Patton Michele L
Bought by
Henson Mark and Woosley Billy
Home Financials for this Owner
Home Financials are based on the most recent Mortgage that was taken out on this home.
Original Mortgage
$42,000
Interest Rate
4.13%
Mortgage Type
Future Advance Clause Open End Mortgage
Purchase Details
Closed on
Mar 6, 2006
Sold by
Scanlan Norden and Scanlan Mary Jane
Bought by
Patton Richard O and Patton Michele L
Home Financials for this Owner
Home Financials are based on the most recent Mortgage that was taken out on this home.
Original Mortgage
$48,000
Interest Rate
6.33%
Mortgage Type
New Conventional
Create a Home Valuation Report for This Property
The Home Valuation Report is an in-depth analysis detailing your home's value as well as a comparison with similar homes in the area
Home Values in the Area
Average Home Value in this Area
Purchase History
| Date | Buyer | Sale Price | Title Company |
|---|---|---|---|
| Woosley Billy D | $56,000 | Attorney | |
| Henson Mark | $40,000 | None Available | |
| Patton Richard O | $60,000 | None Available |
Source: Public Records
Mortgage History
| Date | Status | Borrower | Loan Amount |
|---|---|---|---|
| Closed | Woosley Billy D | $530,000 | |
| Previous Owner | Henson Mark | $42,000 | |
| Previous Owner | Patton Richard O | $48,000 |
Source: Public Records
Tax History
| Year | Tax Paid | Tax Assessment Tax Assessment Total Assessment is a certain percentage of the fair market value that is determined by local assessors to be the total taxable value of land and additions on the property. | Land | Improvement |
|---|---|---|---|---|
| 2024 | $2,927 | $28,074 | $3,667 | $24,407 |
| 2023 | $2,763 | $26,353 | $3,442 | $22,911 |
| 2022 | $2,694 | $25,213 | $3,293 | $21,920 |
| 2021 | $2,600 | $23,776 | $3,105 | $20,671 |
| 2020 | $2,527 | $22,943 | $2,996 | $19,947 |
| 2019 | $2,511 | $22,527 | $2,942 | $19,585 |
| 2018 | $2,485 | $22,563 | $2,947 | $19,616 |
| 2017 | $2,489 | $22,409 | $2,927 | $19,482 |
| 2016 | $2,426 | $21,687 | $2,833 | $18,854 |
| 2015 | $2,320 | $22,282 | $2,911 | $19,371 |
| 2014 | $2,315 | $21,787 | $2,846 | $18,941 |
| 2013 | $2,320 | $22,282 | $2,911 | $19,371 |
Source: Public Records
Map
Nearby Homes
Your Personal Tour Guide
Ask me questions while you tour the home.