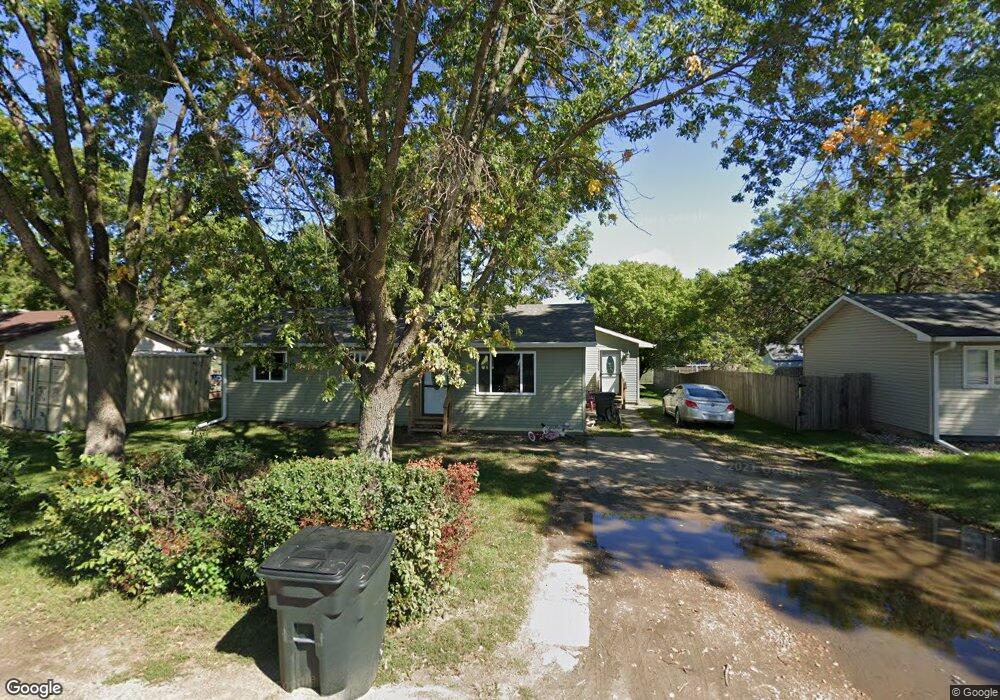
507 E Jefferson St Elk Point, SD 57025
Estimated Value: $199,682 - $239,000
4
Beds
2
Baths
1,520
Sq Ft
$151/Sq Ft
Est. Value
About This Home
This home is located at 507 E Jefferson St, Elk Point, SD 57025 and is currently estimated at $228,921, approximately $150 per square foot. 507 E Jefferson St is a home located in Union County with nearby schools including Elk Point-Jefferson Elementary School, Elk Point-Jefferson Middle School, and Elk Point-Jefferson High School.
Ownership History
Date
Name
Owned For
Owner Type
Purchase Details
Closed on
Mar 3, 2021
Sold by
Jacoby Michael L
Bought by
Schurman Christopher N and Schurman Tammy L
Current Estimated Value
Home Financials for this Owner
Home Financials are based on the most recent Mortgage that was taken out on this home.
Original Mortgage
$111,000
Outstanding Balance
$99,277
Interest Rate
2.7%
Mortgage Type
Future Advance Clause Open End Mortgage
Estimated Equity
$129,644
Purchase Details
Closed on
Nov 1, 2019
Sold by
Holmes Mark A and Holmes Irma O
Bought by
Jacoby Michael L
Home Financials for this Owner
Home Financials are based on the most recent Mortgage that was taken out on this home.
Original Mortgage
$137,464
Interest Rate
3.99%
Mortgage Type
FHA
Purchase Details
Closed on
May 1, 2008
Sold by
Jacoby Eric and Jacoby Michele
Bought by
Holmes Mark A and Holmes Irma O
Home Financials for this Owner
Home Financials are based on the most recent Mortgage that was taken out on this home.
Original Mortgage
$87,875
Interest Rate
5.88%
Mortgage Type
New Conventional
Create a Home Valuation Report for This Property
The Home Valuation Report is an in-depth analysis detailing your home's value as well as a comparison with similar homes in the area
Purchase History
| Date | Buyer | Sale Price | Title Company |
|---|---|---|---|
| Schurman Christopher N | $138,000 | None Available | |
| Jacoby Michael L | $140,000 | None Available | |
| Holmes Mark A | $92,500 | None Available |
Source: Public Records
Mortgage History
| Date | Status | Borrower | Loan Amount |
|---|---|---|---|
| Open | Schurman Christopher N | $111,000 | |
| Previous Owner | Jacoby Michael L | $137,464 | |
| Previous Owner | Holmes Mark A | $87,875 |
Source: Public Records
Tax History
| Year | Tax Paid | Tax Assessment Tax Assessment Total Assessment is a certain percentage of the fair market value that is determined by local assessors to be the total taxable value of land and additions on the property. | Land | Improvement |
|---|---|---|---|---|
| 2025 | $2,421 | $155,072 | $16,520 | $138,552 |
| 2024 | $2,421 | $142,907 | $16,520 | $126,387 |
| 2023 | $2,578 | $142,907 | $16,520 | $126,387 |
| 2022 | $2,233 | $140,756 | $14,369 | $126,387 |
| 2021 | $2,187 | $118,527 | $12,495 | $106,032 |
| 2020 | $2,009 | $113,483 | $12,495 | $100,988 |
| 2019 | $1,878 | $108,084 | $11,900 | $96,184 |
| 2018 | $1,883 | $103,509 | $11,900 | $91,609 |
| 2017 | $1,874 | $103,509 | $0 | $103,509 |
| 2016 | $2,030 | $101,770 | $0 | $101,770 |
| 2015 | $2,030 | $101,770 | $0 | $101,770 |
| 2014 | $2,105 | $101,770 | $0 | $101,770 |
| 2013 | $2,017 | $97,490 | $0 | $97,490 |
| 2012 | $2,017 | $97,490 | $11,900 | $85,590 |
Source: Public Records
Map
Nearby Homes
- 607 E Pleasant St
- 304 S Douglas St
- 138 Green Court Dr
- 903 E Main St
- 103 Maple Ct
- 402 S Pearl St
- 409 E Rose St
- 1207 Jack Nicklaus Dr
- 1105 Country Club Dr
- 1103 Country Club Dr
- 1206 Jack Nicklaus Dr
- TBD Country Club Dr
- 1107 Country Club Dr
- 1109 Country Club Dr
- 1108 Country Club Dr
- 1110 Country Club Dr
- 1202 Country Club Dr
- 1201 Country Club Dr
- 1207 Country Club Dr
- 1204 Country Club Dr
- 509 E Jefferson St
- 505 E Jefferson St
- 312 S Pinckney St
- 502 E Jefferson St
- 506 E Clay St
- 504 E Clay St
- 508 E Clay St
- 304 S Pinckney St
- 603 E Jefferson St
- 504 E Jefferson St
- 606 E Clay St
- 403 S Walnut St
- 409 E Jefferson St
- 607 E Jefferson St
- 408 E Jefferson St
- 333 S Pinckney St
- 212 S Pinckney St
- 211 S Walnut St
- 505 E Clay St
- 209 S Walnut St
Your Personal Tour Guide
Ask me questions while you tour the home.