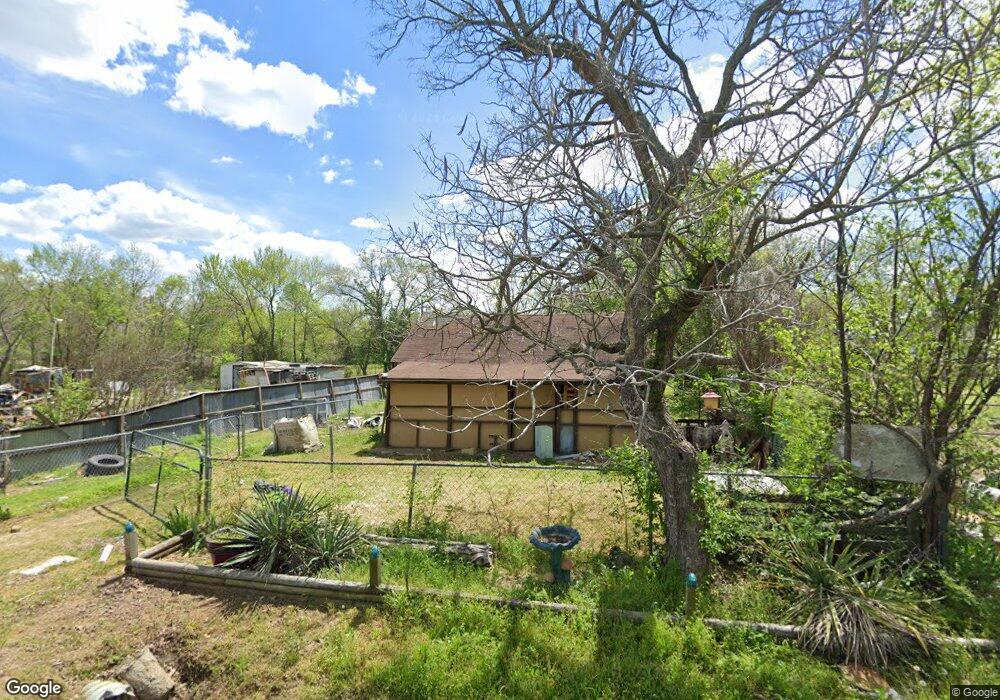
507 E Spruce Henryetta, OK 74437
Estimated Value: $44,000 - $139,000
2
Beds
1
Bath
608
Sq Ft
$130/Sq Ft
Est. Value
About This Home
This home is located at 507 E Spruce, Henryetta, OK 74437 and is currently estimated at $78,916, approximately $129 per square foot. 507 E Spruce is a home located in Okmulgee County with nearby schools including Henryetta Elementary School, Henryetta Middle School, and Henryetta High School.
Ownership History
Date
Name
Owned For
Owner Type
Purchase Details
Closed on
Oct 15, 2024
Sold by
Mcdonald Danny Wayne
Bought by
Cope Jeremy
Current Estimated Value
Purchase Details
Closed on
Jun 18, 2004
Sold by
Brian Lynette F
Bought by
Thompson Delbert K
Purchase Details
Closed on
Sep 22, 1998
Sold by
Shurden Stephen E
Bought by
Brian Lynette F
Purchase Details
Closed on
Jun 11, 1998
Sold by
Price Michael
Bought by
Shurden Stephen E
Purchase Details
Closed on
Feb 10, 1995
Sold by
Ruth Richardson Etal
Bought by
Lynette Brian
Create a Home Valuation Report for This Property
The Home Valuation Report is an in-depth analysis detailing your home's value as well as a comparison with similar homes in the area
Home Values in the Area
Average Home Value in this Area
Purchase History
| Date | Buyer | Sale Price | Title Company |
|---|---|---|---|
| Cope Jeremy | $4,000 | None Listed On Document | |
| Thompson Delbert K | $17,000 | -- | |
| Brian Lynette F | $6,500 | -- | |
| Shurden Stephen E | $5,000 | -- | |
| Lynette Brian | $11,000 | -- |
Source: Public Records
Tax History
| Year | Tax Paid | Tax Assessment Tax Assessment Total Assessment is a certain percentage of the fair market value that is determined by local assessors to be the total taxable value of land and additions on the property. | Land | Improvement |
|---|---|---|---|---|
| 2025 | $268 | $2,483 | $600 | $1,883 |
| 2024 | $269 | $2,318 | $600 | $1,718 |
| 2023 | $226 | $2,318 | $600 | $1,718 |
| 2022 | $229 | $2,344 | $600 | $1,744 |
| 2021 | $233 | $2,344 | $600 | $1,744 |
| 2020 | $233 | $2,349 | $600 | $1,749 |
| 2019 | $231 | $2,352 | $600 | $1,752 |
| 2018 | $232 | $2,358 | $600 | $1,758 |
| 2017 | $232 | $2,348 | $600 | $1,748 |
| 2016 | $221 | $2,237 | $600 | $1,637 |
| 2015 | $185 | $2,334 | $577 | $1,757 |
| 2014 | $179 | $2,223 | $540 | $1,683 |
Source: Public Records
Map
Nearby Homes
Your Personal Tour Guide
Ask me questions while you tour the home.