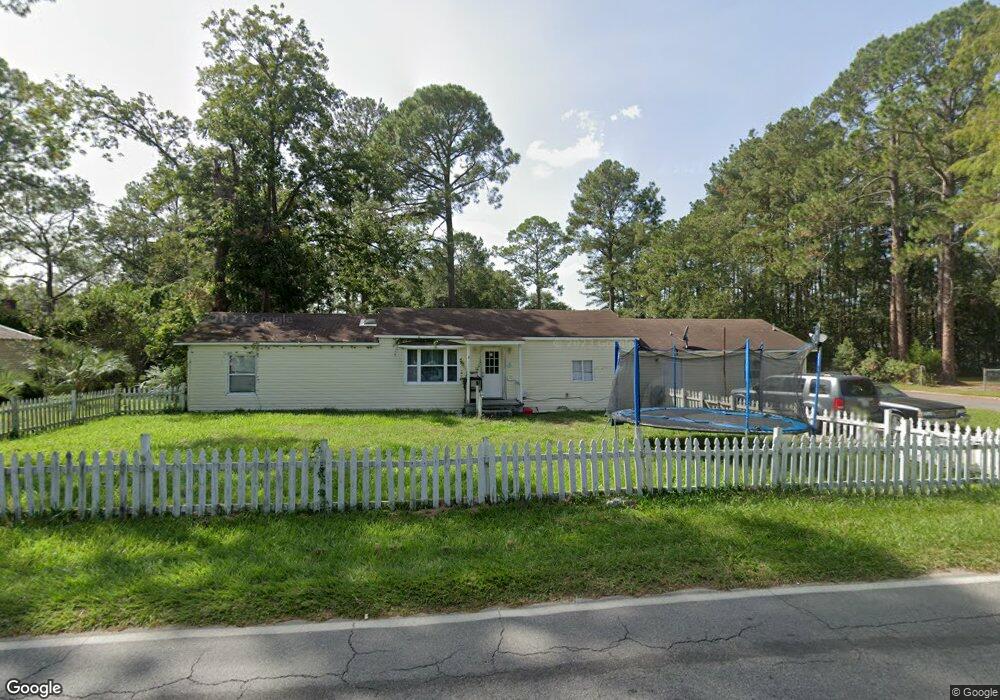
507 Garlington Ave Unit 1 & 2 Waycross, GA 31503
Estimated Value: $72,000 - $146,000
3
Beds
2
Baths
2,288
Sq Ft
$49/Sq Ft
Est. Value
About This Home
This home is located at 507 Garlington Ave Unit 1 & 2, Waycross, GA 31503 and is currently estimated at $111,746, approximately $48 per square foot. 507 Garlington Ave Unit 1 & 2 is a home located in Ware County with nearby schools including Waresboro Elementary School, Ware County Middle School, and Ware County High School.
Ownership History
Date
Name
Owned For
Owner Type
Purchase Details
Closed on
Jun 6, 2022
Sold by
Go America Llc
Bought by
Kidd Shanna
Current Estimated Value
Purchase Details
Closed on
Dec 14, 2021
Sold by
Dsv Spv 2 Llc
Bought by
Go America Llc
Purchase Details
Closed on
Jul 31, 2017
Sold by
Alan Investments Iii Llc
Bought by
Dsv Spv2 Llc
Purchase Details
Closed on
Jul 28, 2017
Sold by
Herrin Levey
Bought by
Thrift Retha J
Purchase Details
Closed on
Jan 7, 2016
Sold by
The Bank Of New York Mello
Bought by
Alan Investments Iii Llc
Purchase Details
Closed on
Oct 6, 2015
Sold by
Dorsey Patricia
Bought by
The Bank Of New York Mellon Tr
Purchase Details
Closed on
May 9, 2003
Sold by
Douglas Joseph M
Bought by
Dorsey Patricia
Create a Home Valuation Report for This Property
The Home Valuation Report is an in-depth analysis detailing your home's value as well as a comparison with similar homes in the area
Home Values in the Area
Average Home Value in this Area
Purchase History
| Date | Buyer | Sale Price | Title Company |
|---|---|---|---|
| Kidd Shanna | $32,500 | -- | |
| Go America Llc | $34,301 | -- | |
| Dsv Spv2 Llc | -- | -- | |
| Thrift Retha J | -- | -- | |
| Alan Investments Iii Llc | $12,500 | -- | |
| The Bank Of New York Mellon Tr | $34,080 | -- | |
| Dorsey Patricia | $60,000 | -- |
Source: Public Records
Tax History Compared to Growth
Tax History
| Year | Tax Paid | Tax Assessment Tax Assessment Total Assessment is a certain percentage of the fair market value that is determined by local assessors to be the total taxable value of land and additions on the property. | Land | Improvement |
|---|---|---|---|---|
| 2024 | $1,261 | $32,705 | $2,368 | $30,337 |
| 2023 | $1,128 | $33,110 | $1,673 | $31,437 |
| 2022 | $576 | $14,450 | $892 | $13,558 |
| 2021 | $1,111 | $25,687 | $1,673 | $24,014 |
| 2020 | $1,104 | $25,323 | $1,673 | $23,650 |
| 2019 | $918 | $20,775 | $1,673 | $19,102 |
| 2018 | $887 | $19,865 | $1,673 | $18,192 |
| 2017 | $866 | $19,865 | $1,673 | $18,192 |
| 2016 | $866 | $19,865 | $1,673 | $18,192 |
| 2015 | $795 | $19,864 | $1,673 | $18,192 |
| 2014 | $794 | $19,865 | $1,673 | $18,192 |
| 2013 | -- | $23,764 | $1,672 | $22,092 |
Source: Public Records
Map
Nearby Homes
- 0 Camp Branch Cross Rd Unit 12958956
- 0 Camp Branch Cross Rd Unit 147575
- 0 Camp Branch Cross Rd Unit 10127958
- 6905 Kendal Ct
- 1401 Carswell Ave
- 1322 Jane St
- 0 S Georgia Pkwy W
- 00 Roosevelt St
- 605 Walker St
- 1208 Margaret St
- 1003 Carswell Ave
- 601 N Nicholls St
- 505 N Nicholls St
- 503 N Nicholls St
- 1006 Roosevelt St
- 1125 Georgia St
- 1103 Ann St
- 506 McDonald St
- 803 Elizabeth St
- 516 Folks St
- 507 Garlington Ave
- 1402 Isabella St
- 1407 Pine St
- 1404 Isabella St
- 509 Garlington Ave
- 502 Garlington Ave
- 1408 Isabella St
- 1412 Isabella St
- 1330 Isabella St
- 508 Garlington Ave
- 1410 Pine St
- 1501 Carswell Ave
- 1401 Isabella St
- 1327 Pine St
- 1503 Carswell Ave
- 1411 Pine St
- 1412 Pine St
- 1425 Isabella St
- 1326 Pine St
- 1419 1/2 Carswell Ave