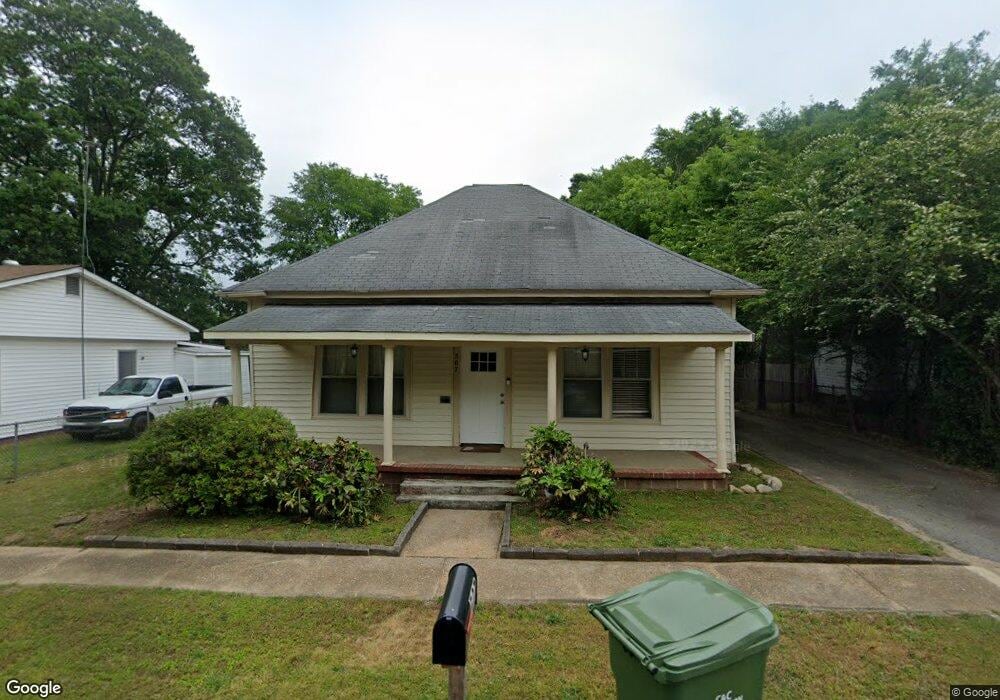
507 Granite St Hogansville, GA 30230
Estimated Value: $170,568 - $232,000
2
Beds
1
Bath
1,505
Sq Ft
$138/Sq Ft
Est. Value
About This Home
This home is located at 507 Granite St, Hogansville, GA 30230 and is currently estimated at $208,142, approximately $138 per square foot. 507 Granite St is a home located in Troup County with nearby schools including Hogansville Elementary School, Callaway Elementary School, and Callaway Middle School.
Ownership History
Date
Name
Owned For
Owner Type
Purchase Details
Closed on
Jun 5, 2020
Sold by
Bugg Robert C
Bought by
Sharon R Enterprises Llc
Current Estimated Value
Home Financials for this Owner
Home Financials are based on the most recent Mortgage that was taken out on this home.
Original Mortgage
$58,000
Interest Rate
3.2%
Mortgage Type
New Conventional
Purchase Details
Closed on
Mar 31, 2003
Sold by
Secretary Of Hud
Bought by
East Thomas
Purchase Details
Closed on
Dec 4, 2002
Sold by
Chase Manhattan
Bought by
Secretary Of Hud
Purchase Details
Closed on
Dec 3, 2002
Sold by
Merritt June
Bought by
Chase Manhattan
Purchase Details
Closed on
Sep 28, 2000
Sold by
Burke James P
Bought by
Merritt June
Purchase Details
Closed on
Dec 31, 1993
Sold by
Agnes Burke
Bought by
Burke James P
Purchase Details
Closed on
Feb 8, 1991
Sold by
Burke H O
Bought by
Agnes Burke
Create a Home Valuation Report for This Property
The Home Valuation Report is an in-depth analysis detailing your home's value as well as a comparison with similar homes in the area
Home Values in the Area
Average Home Value in this Area
Purchase History
| Date | Buyer | Sale Price | Title Company |
|---|---|---|---|
| Sharon R Enterprises Llc | $108,000 | -- | |
| East Thomas | $37,000 | -- | |
| Secretary Of Hud | $51,700 | -- | |
| Chase Manhattan | $51,700 | -- | |
| Merritt June | $46,800 | -- | |
| Burke James P | -- | -- | |
| Agnes Burke | -- | -- |
Source: Public Records
Mortgage History
| Date | Status | Borrower | Loan Amount |
|---|---|---|---|
| Closed | Sharon R Enterprises Llc | $58,000 |
Source: Public Records
Tax History Compared to Growth
Tax History
| Year | Tax Paid | Tax Assessment Tax Assessment Total Assessment is a certain percentage of the fair market value that is determined by local assessors to be the total taxable value of land and additions on the property. | Land | Improvement |
|---|---|---|---|---|
| 2024 | $1,396 | $39,624 | $8,000 | $31,624 |
| 2023 | $1,290 | $36,624 | $8,000 | $28,624 |
| 2022 | $989 | $27,584 | $4,000 | $23,584 |
| 2021 | $428 | $11,708 | $1,880 | $9,828 |
| 2020 | $446 | $11,708 | $1,880 | $9,828 |
| 2019 | $441 | $11,568 | $1,880 | $9,688 |
| 2018 | $400 | $10,492 | $1,920 | $8,572 |
| 2017 | $400 | $10,492 | $1,920 | $8,572 |
| 2016 | $416 | $10,908 | $1,920 | $8,988 |
| 2015 | $494 | $12,954 | $1,915 | $11,039 |
| 2014 | $298 | $7,802 | $1,915 | $5,888 |
| 2013 | -- | $8,582 | $1,915 | $6,668 |
Source: Public Records
Map
Nearby Homes
- 100 International St
- 407 Green Ave
- 400 Lawrence St
- 215 Johnson St
- 213 Johnson St
- 606 Green Ave
- 404 Lincoln St
- 208 Royal Ave
- 203 White Ave
- 205 White St
- 214 Collier St
- 402 Power Plant Rd
- 117 Duck Walk Way
- 209 Duck Walk Way
- 0 Georgia 100 Unit 10591508
- 613 Rifle Ridge
- 617 Rifle Ridge
- 619 Rifle Ridge
- 608 Rifle Ridge
- 614 Rifle Ridge
- 505 Granite St
- 509 Granite St
- 503 Granite St
- 104 International St
- 506 Granite St
- 106 International St
- 504 Granite St
- 108 International St
- 102 International St
- 513 Granite St
- 501 Granite St
- 508 Granite St
- 500 Granite St
- 110 International St
- 300 Askew Ave
- 204 Askew Ave
- 111 Green Ave
- 112 International St
- 0 International St Unit 7428450
- 0 International St Unit 8180626