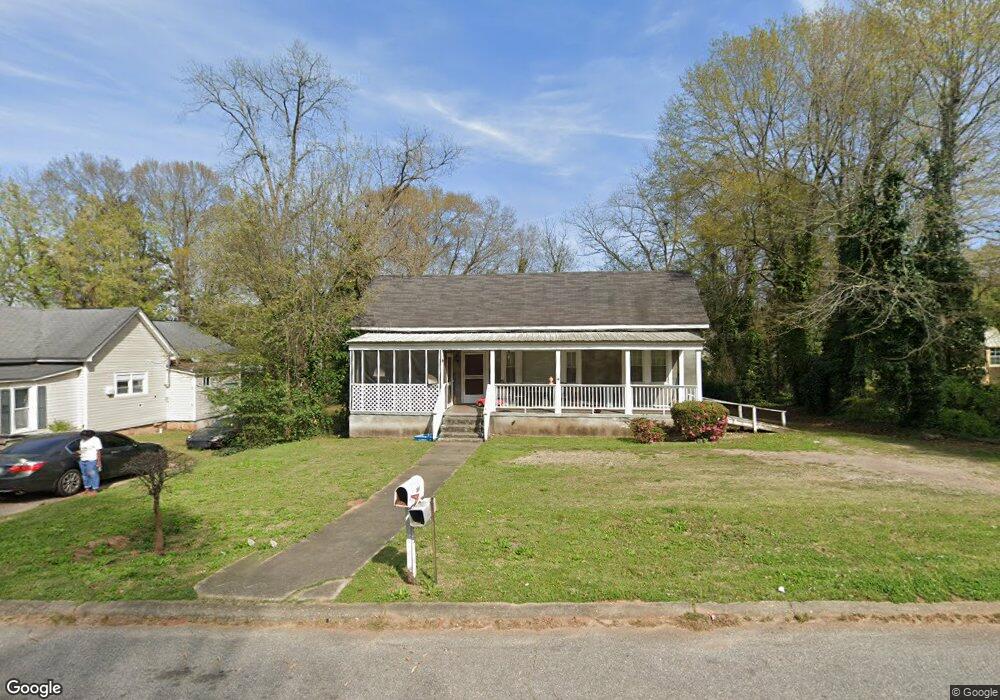
507 Harwell Ave Lagrange, GA 30240
Estimated Value: $115,000 - $127,000
3
Beds
2
Baths
1,502
Sq Ft
$79/Sq Ft
Est. Value
About This Home
This home is located at 507 Harwell Ave, Lagrange, GA 30240 and is currently estimated at $119,405, approximately $79 per square foot. 507 Harwell Ave is a home located in Troup County with nearby schools including Ethel W. Kight Elementary School, Hollis Hand Elementary School, and Franklin Forest Elementary School.
Ownership History
Date
Name
Owned For
Owner Type
Purchase Details
Closed on
Jan 10, 2001
Bought by
Johnson Sylvia
Current Estimated Value
Purchase Details
Closed on
Nov 14, 1997
Sold by
Richmond B Peyton
Purchase Details
Closed on
Aug 26, 1994
Sold by
Richard B Payton
Bought by
Richmond B Peyton
Purchase Details
Closed on
Mar 21, 1994
Sold by
Peyton J
Bought by
Richard B Payton
Purchase Details
Closed on
Feb 17, 1982
Sold by
Peyton Bryan R
Bought by
Peyton J
Purchase Details
Closed on
Feb 15, 1982
Sold by
Bolt Bobby M Etal
Bought by
Peyton Bryan R
Purchase Details
Closed on
Feb 1, 1982
Sold by
Bolt Elizabeth
Bought by
Bolt Bobby M Etal
Purchase Details
Closed on
Jul 5, 1978
Sold by
Bolt Bobby
Bought by
Bolt Elizabeth
Purchase Details
Closed on
Jun 17, 1976
Sold by
Bolt E O
Bought by
Bolt Bobby
Purchase Details
Closed on
Sep 1, 1946
Bought by
Bolt E O
Create a Home Valuation Report for This Property
The Home Valuation Report is an in-depth analysis detailing your home's value as well as a comparison with similar homes in the area
Home Values in the Area
Average Home Value in this Area
Purchase History
| Date | Buyer | Sale Price | Title Company |
|---|---|---|---|
| Johnson Sylvia | -- | -- | |
| -- | -- | -- | |
| Richmond B Peyton | $39,700 | -- | |
| Richard B Payton | -- | -- | |
| Peyton J | -- | -- | |
| Peyton Bryan R | $28,000 | -- | |
| Bolt Bobby M Etal | -- | -- | |
| Bolt Elizabeth | -- | -- | |
| Bolt Bobby | -- | -- | |
| Bolt E O | -- | -- |
Source: Public Records
Tax History Compared to Growth
Tax History
| Year | Tax Paid | Tax Assessment Tax Assessment Total Assessment is a certain percentage of the fair market value that is determined by local assessors to be the total taxable value of land and additions on the property. | Land | Improvement |
|---|---|---|---|---|
| 2024 | $827 | $32,320 | $4,360 | $27,960 |
| 2023 | $752 | $29,560 | $4,360 | $25,200 |
| 2022 | $730 | $28,160 | $4,360 | $23,800 |
| 2021 | $645 | $23,360 | $4,360 | $19,000 |
| 2020 | $645 | $23,360 | $4,360 | $19,000 |
| 2019 | $608 | $22,140 | $4,500 | $17,640 |
| 2018 | $608 | $22,140 | $4,500 | $17,640 |
| 2017 | $608 | $22,140 | $4,500 | $17,640 |
| 2016 | $600 | $21,868 | $4,500 | $17,368 |
| 2015 | $597 | $21,736 | $4,368 | $17,368 |
| 2014 | $570 | $20,822 | $4,368 | $16,454 |
| 2013 | -- | $25,938 | $4,364 | $21,574 |
Source: Public Records
Map
Nearby Homes
- 505 Harwell Ave
- 511 Harwell Ave
- 503 Harwell Ave
- 606 S Greenwood St
- 513 Harwell Ave
- 608 S Greenwood St
- 501 Harwell Ave
- 600 S Greenwood St
- 510 Harwell Ave
- 515 Harwell Ave
- 508 Harwell Ave
- 514 Harwell Ave
- 512 Harwell Ave
- 610 S Greenwood St
- 612 S Greenwood St
- 506 Harwell Ave
- 102 Wilkes St
- 500 Harwell Ave
- 516 Harwell Ave
- 504 Harwell Ave